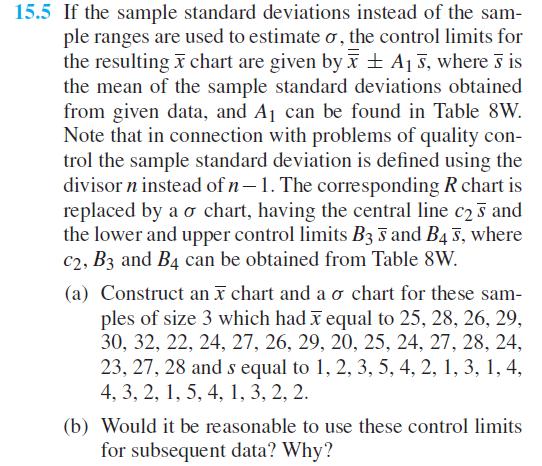
In order to establish control charts for an extraction job, 30 samples of five measurements of the
Question:
In order to establish control charts for an extraction job, 30 samples of five measurements of the extracted ores are taken, and the results are \(\overline{\bar{x}}=25.96\) tons and \(\bar{s}=1.5\) tons. Using the method of Exercise 15.5, construct an \(\bar{x}\) chart for \(n=5\) and on it plot the following means obtained in 25 successive samples: 24.15 25 .16 27.86 26.89 27.85 28.96 32.45 19.95 22.15 23.96 25.18 25.15 24.19 29.86 25.81 22.45 26.95 28.42 27.35 24 .12 21 .36 28 .45 27 .61 23 .95 24.81. Discuss the results.
Data From Exercise 15.5

Step by Step Answer:
Related Book For 

Probability And Statistics For Engineers
ISBN: 9780134435688
9th Global Edition
Authors: Richard Johnson, Irwin Miller, John Freund
Question Posted:


