

The following data give the means and ranges of 25 samples, each consisting of 4 compression test
Question:
The following data give the means and ranges of 25 samples, each consisting of 4 compression test results on steel forgings, in thousands of pounds per square inch:
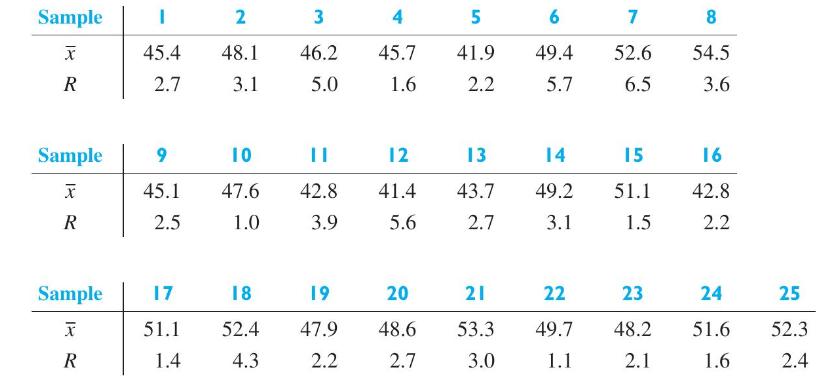
(a) Use these data to find the central line and control limits for an \(\bar{x}\) chart.
(b) Use these data to find the central line and control limits for an \(R\) chart.
(c) Plot the given data on \(\bar{x}\) and \(R\) charts based on the control-chart constants computed in parts (a) and (b), and interpret the results.
(d) Using runs above and below the central line (similar to runs above and below the median discussed on page 474), test at a level of significance of 0.05 whether there is a trend in the \(\bar{x}\) values.
(e) Would it be reasonable to use the control limits found in this exercise in connection with subsequent compression test measurements from the same process? Why or why not?
Data From Page 474
Step by Step Answer:

This question has not been answered yet.
You can Ask your question!

Probability And Statistics For Engineers
ISBN: 9780134435688
9th Global Edition
Authors: Richard Johnson, Irwin Miller, John Freund
