

Question: With reference to the lumber-strength data in Exercise 2.59, the statistical software package $S A S$ produced the output in Figure 2.20. Using this output,
With reference to the lumber-strength data in Exercise 2.59, the statistical software package $S A S$ produced the output in Figure 2.20. Using this output,
(a) identify the mean and standard deviation and compare these answers with the values given in Exercise 2.59.
(b) Create a boxplot.
Variable: Strength The UNIVARIATE Procedure
| Moments | |||
|---|---|---|---|
| $\mathrm{N}$ | 30 | Sum Weights | 30 |
| Mean | 1908.76667 | Sum Observations | 57263 |
| Std Dev | ion 327.115047 | Variance | 107004.254 |
| Basic Statistical Measures | |||
| Location | Variability | ||
| Mean | 1908.767 | Std Deviation | 327.11505 |
| Median | 1863.000 | Variance | 107004 |
| Range | 1658 | ||
| erquartile Range | 349.00000 |
| Level | Quantile |
|---|---|
| 100% Max | 2983.0 |
| $99 %$ | 2983.0 |
| $95 %$ | 2403.0 |
| $90 %$ | 2301.0 |
| 75% Q3 | 2061.0 |
| $50 %$ Median | 1863.0 |
| 25% Q1 | 1712.0 |
| 10% | 1561.5 |
| $5 %$ | 1419.0 |
| $1 %$ | 1325.0 |
| 0% Min | 1325.0 |
Figure 2.20 Selected SAS output to describe the lumber strength data from Exercise 2.59
Data From Exercise 2.59
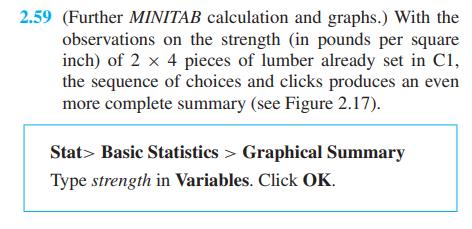
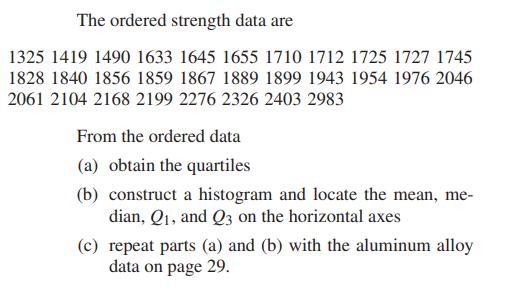
2.59 (Further MINITAB calculation and graphs.) With the observations on the strength (in pounds per square inch) of 2 x 4 pieces of lumber already set in C1, the sequence of choices and clicks produces an even more complete summary (see Figure 2.17). Stat Basic Statistics > Graphical Summary Type strength in Variables. Click OK.
Step by Step Solution
3.50 Rating (157 Votes )
There are 3 Steps involved in it

Get step-by-step solutions from verified subject matter experts