

Question: solve the question Exercise 30 (Section 3.3) gave the pmf of Y, the number of traffic citations for a randomly selected individual insured by a
solve the question
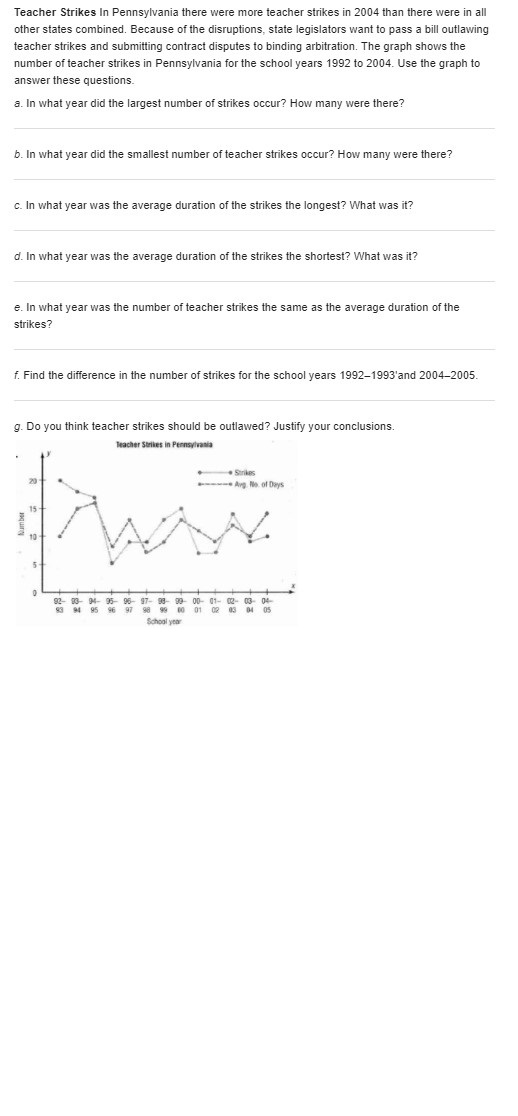

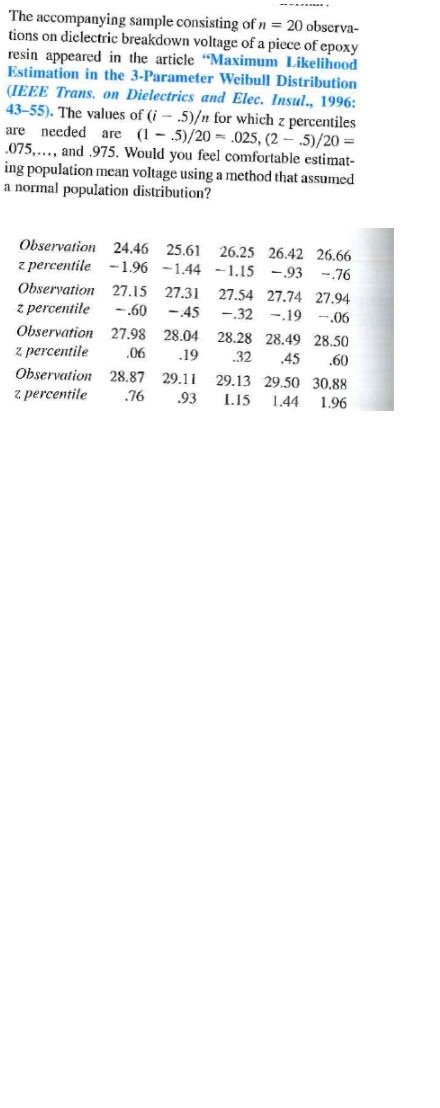
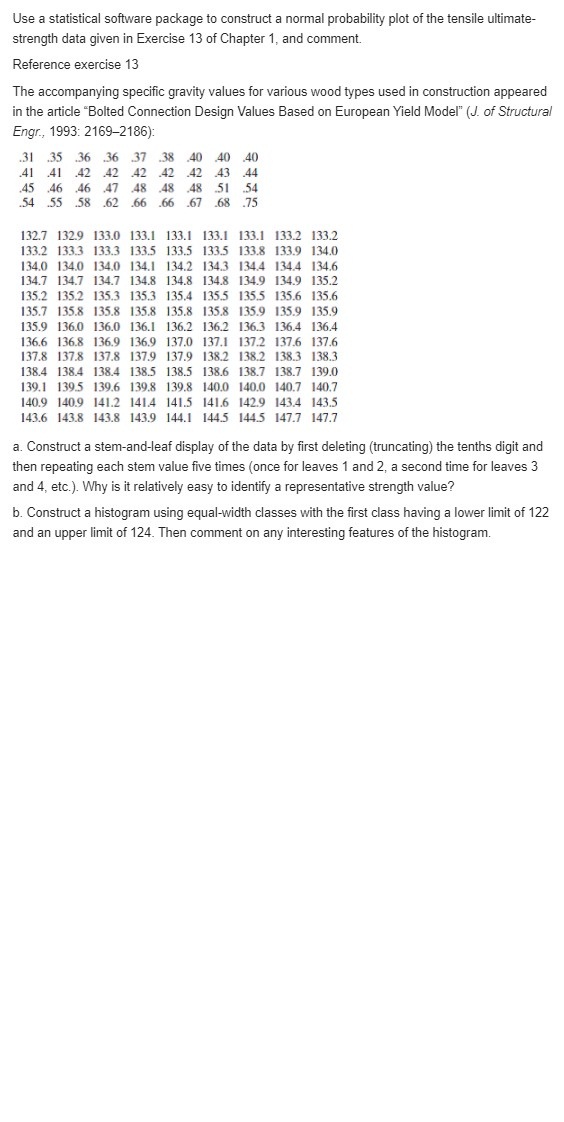
Exercise 30 (Section 3.3) gave the pmf of Y, the number of traffic citations for a randomly selected individual insured by a particular company. What is the probability that among 15 randomly chosen such individuals a. At least 10 have no citations? b. Fewer than half have at least one citation? c. The number that have at least one citation is between 5 and 10, inclusive?* Reference exercise 30 An individual who has automobile insurance from a certain company is randomly selected. Let Y be the number of moving violations for which the individual was cited during the last 3 years. The 0 1 2 3 pmf of Y is P(y) .60 .25 .10 .05 a. Compute E(Y). b. Suppose an individual with Y violations incurs a surcharge of $100. Calculate the expected amount of the surcharge.Teacher Strikes In Pennsylvania there were more teacher strikes in 2004 than there were in all other states combined. Because of the disruptions, state legislators want to pass a bill outlawing teacher strikes and submitting contract disputes to binding arbitration. The graph shows the number of teacher strikes in Pennsylvania for the school years 1992 to 2004. Use the graph to answer these questions. a. In what year did the largest number of strikes occur? How many were there? b. In what year did the smallest number of teacher strikes occur? How many were there? c. In what year was the average duration of the strikes the longest? What was it? d. In what year was the average duration of the strikes the shortest? What was it? e. In what year was the number of teacher strikes the same as the average duration of the strikes? f. Find the difference in the number of strikes for the school years 1992-1993'and 2004-2005. g. Do you think teacher strikes should be outlawed? Justify your conclusions. Teacher Strikes in Pennsylvania Strikes 20 - Arg. Milo. of Days 15 Number 10 5 M- 95 95- 17- 95 96 97 98 99 39 00- 41- 02- 04- 01 School yearThe Centers for Disease Control and Prevention reported in 2012 that 1 in 88 American children had been diagnosed with an autism spectrum disorder (ASD). a. If a random sample of 200 American children is selected, what are the expected value and standard deviation of the number who have been diagnosed with ASD? b. Referring back to (a), calculate the approximate probability that at least 2 children in the sample have been diagnosed with ASD? c. If the sample size is 352, what is the approximate probability that fewer than 5 of the selected children have been diagnosed with ASD?A box contains the following four slips df paper, each having exactly the same dimensions: {1] win prize 1; {2} win prize 2; {3] win prize 3; [4] win prizes 1, 2, and 3. Cine slip will be randenijr selected. Let A1 ={win prize 1},A2={win pri2e2}, and A3 =[win prize 3},_ Show that A1 and A2 are independent, that A1 and A3 are independent and that A2 and A3 are also independent [this is pain-rise independence]. However, show that P9511 I'l A2 Pl A3} #P[A1}.P{A2].P[A3]1 so the three events are not mutually:r independent Spray drift is a constant concern for pesticide applicators and agricultural producers. The inverse relationship between droplet size and drift potential is well known. The paper "Effects of 2,4-D Formulation and Quinclorac on Spray Droplet Size and Deposition" (Weed Technology, 2005: 1030-1036) investigated the effects of herbicide formulation on spray atomization. A figure in the paper suggested the normal distribution with mean 1050 um and standard deviation 150 um was a reasonable model for droplet size for water (the "control treatment") sprayed through a 760 ml/min nozzle. a. What is the probability that the size of a single droplet is less than 1500 um ? At least 1000um b. What is the probability that the size of a single droplet is between 1000 um and ? c. How would you characterize the smallest 2% of all droplets? d. If the sizes of five independently selected droplets are measured, what is the probability that at least one exceeds 1500um?Chebyshev's inequality, (see Exercise 44, Chapter 3), is valid for continuous as well as discrete distributions. It states that for any number k satisfying k 2 1, P(IX - p 2ko) =1/k (see Exercise 44 in Chapter 3 for an interpretation). Obtain this probability in the case of a normal distribution for , 2, and 3, and compare to the upper bound. Reference exercise 44 A result called Chebyshev's inequality states that for any probability distribution of an rv X and any number k that is at least 1, P( | X - p | k o) $ 1/k2 . In words, the probability that the value of X lies at least k standard deviations from its mean is at most 1/12. a. What is the value of the upper bound for k = 2? K + 3? K = 4? K= 5? K = 10? b. Compute p and o for the distribution of Exercise 13. Then evaluate P()X - p| 2 ko) for the values of k given in part (a). What does this suggest about the upper bound relative to the corresponding probability? c. Let X have possible values -1, 0, and 1, with probabilities 1/18, 8/9 and 1/8 , respectively. What is P(1X - p/2 30), and how does it compare to the corresponding bound? d. Give a distribution for which P(IX - p|2 50) = .04.The accompanying sample consisting of n = 20 observa- tions on dielectric breakdown voltage of a piece of epoxy resin appeared in the article "Maximum Likelihood Estimation in the 3-Parameter Weibull Distribution (IEEE Trans. on Dielectrics and Elec. Insul., 1996: 43-55). The values of (i - .5) for which z percentiles are needed are (1 - .5)/20 = .025, (2 - .5)/20 = .075,..., and .975. Would you feel comfortable estimat- ing population mean voltage using a method that assumed a normal population distribution? Observation 24.46 25.61 26.25 26.42 26.66 z percentile -1.96 -1.44 -1.15 -.93 -.76 Observation 27.15 27.31 27.54 27.74 27.94 z percentile -.60 -.45 -.32 -.19 -.06 Observation 27.98 28.04 28.28 28.49 28.50 z percentile .06 .19 .32 45 .60 Observation 28.87 29.11 29.13 29.50 30.88 z percentile .76 .93 1.15 1.44 1.96Use a statistical software package to construct a normal probability plot of the tensile ultimate- strength data given in Exercise 13 of Chapter 1, and comment. Reference exercise 13 The accompanying specific gravity values for various wood types used in construction appeared in the article "Bolted Connection Design Values Based on European Yield Model" (J. of Structural Engr., 1993: 2169-2186): 31 .35 .36 .36 37 .38 40 40 40 .41 41 42 42 42 42 42 43 44 45 46 46 47 48 48 48 51 54 54 55 58 62 66 .66 67 .68 .75 132.7 132.9 133.0 133.1 133.1 133.1 133.1 133.2 133.2 133.2 133.3 133.3 1335 133.5 1335 133.8 133.9 134.0 134.0 134.0 134.0 134.1 134.2 134.3 134.4 134.4 134.6 134.7 134.7 134.7 134.8 134.8 134.8 134.9 134.9 135.2 135.2 135.2 135.3 135.3 135.4 135.5 135.5 135.6 135.6 135.7 135.8 135.8 135.8 135.8 135.8 135.9 135.9 135.9 135.9 136.0 136.0 136.1 136.2 136.2 136.3 136.4 136.4 136.6 136.8 136.9 136.9 137.0 137.1 137.2 137.6 137.6 137.8 137.8 137.8 137.9 137.9 138.2 138.2 138.3 138.3 138.4 138.4 138.4 138.5 138.5 138.6 138.7 138.7 139.0 139.1 139.5 139.6 139.8 139.8 140.0 140.0 140.7 140.7 140.9 140.9 141.2 141.4 141.5 141.6 142.9 1434 143.5 143.6 143.8 143.8 143.9 144.1 1445 1445 147.7 147.7 a. Construct a stem-and-leaf display of the data by first deleting (truncating) the tenths digit and then repeating each stem value five times (once for leaves 1 and 2, a second time for leaves 3 and 4, etc.). Why is it relatively easy to identify a representative strength value? b. Construct a histogram using equal-width classes with the first class having a lower limit of 122 and an upper limit of 124. Then comment on any interesting features of the histogram
Step by Step Solution
There are 3 Steps involved in it

Get step-by-step solutions from verified subject matter experts