

A random sample of 100 high school students was taken and the following table gives a summary
Question:
A random sample of 100 high school students was taken and the following table gives a summary of their responses when they were asked what their favorite season is. We are interested in testing to see whether the distribution of favorite seasons of high school students in the database is not distributed evenly
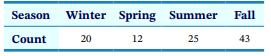
a. What are the expected frequencies for each season?
b. Write out the hypotheses.
c. Calculate the test statistic and appropriate p-value.
d. State your conclusion in the context of the research question.
Fantastic news! We've Found the answer you've been seeking!
Step by Step Answer:
a Each is 25 b H 0 Each season is equally likely to be a favorite 1 14 4 ...View the full answer

Answered By
Tanveer Bhat
I have done masters in masters in 2016 from Kashmir University. During this period i read mainly complex analysis, Modern Algebra, Linear Algebra. I have worked fro 2017 to 2019 as tutor in various institutes like DIPS Academy New Delhi. As my tenure as tutor, my main focus was how to make students ease at learning.
0 Reviews
10+ Question Solved
Related Book For 

Introduction To Statistical Investigations
ISBN: 9781119683452
2nd Edition
Authors: Beth L.Chance, George W.Cobb, Allan J.Rossman Nathan Tintle, Todd Swanson Soma Roy
Question Posted:
