

Two samples of Facebook users chosen by the Pew Research Center (one in 2019 and one in
Question:
Two samples of Facebook users chosen by the Pew Research Center (one in 2019 and one in 2013) were asked how often they visit or use Facebook. The results are shown in the two-way table. We will assume the people in these samples are representative of all American Facebook users for the two given years. Is there evidence of a difference in Facebook usage by American Facebook users in 2019 compared to in 2013?
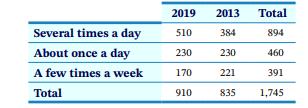
a. Several times a day was the most common response for both years. Which year had the larger proportion respond that they used Facebook several times a day?
b. Could you use the Mean Group Diff to compare Facebook usage for the two years as presented in these summarized data? Explain.
c. State the hypotheses for a chi-square test.
d. Use the appropriate applet to find the p-value.
e. State your conclusion in the context of the research question and if your results are significant, use follow-up confidence intervals to determine what is significantly different between the two years.
Step by Step Answer:
a 2019 560 compared to 460 b You could not use the Mean ...View the full answer


Introduction To Statistical Investigations
ISBN: 9781119683452
2nd Edition
Authors: Beth L.Chance, George W.Cobb, Allan J.Rossman Nathan Tintle, Todd Swanson Soma Roy
