

Consider the quarterly rates of growth contained in data file (g f c) used in Exercise 13.14.
Question:
Consider the quarterly rates of growth contained in data file \(g f c\) used in Exercise 13.14. A researcher in the Euro Area (this is the group of countries in Europe where the Euro currency is the legal tender) is interested in testing the proposition that growth in the Euro region is affected by its own history, growth in the United States, and shocks to economic activity.
a. Specify and estimate an econometric model for the Euro Area based only on its own history and where the expected effect of shocks on the expected quarterly rate of growth is zero.
b. Specify and estimate an econometric model for the Euro Area based only on its own history and where shocks may come from distributions with zero mean, but time-varying variances.
c. Specify and estimate an econometric model for the Euro Area based on its own history, the history of growth in the United States, and where the expected effect of shocks on the expected quarterly rate of growth is zero.
d. Specify and estimate an econometric model for the Euro Area based on its own history and allow shocks in the Euro Area to have an effect of zero on the quarterly rate of growth.
e. Specify and estimate an econometric model for the Euro Area based on its own history, the history of growth in the United States, and where shocks in the Euro Area and in the United States have an effect on the expected quarterly rate of growth.
Data From Exercise 13.14:-
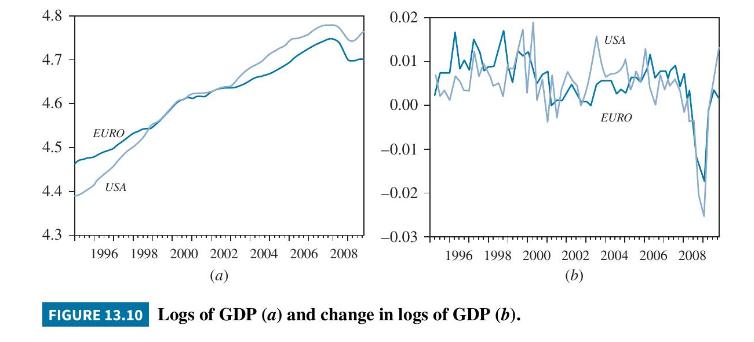
The file \(g f c\) contains data about economic activity in two major economies: the United States and the Euro Area (the group of countries in Europe where the Euro currency is the legal tender). Specifically, the data are the logs of their GDP, standardized so that the value of GDP is equal to 100 in 2000 . The levels and the change in economic activity are shown in Figure 13.10(a) and (b). The sample period is from 1995Q1 to 2009Q4 and includes the global financial crisis that began in September 2007.
a. Based on a visual inspection of the data, what would you infer about the interactions between the GDPs in the two economies?
b. Do the economies have a long-run relationship? Specify the econometric model and estimate the model. Plot the residuals and comment on their properties.
c. Do the economies have a short-run relationship? Specify the econometric model and estimate the model. Plot the residuals and comment on their properties.
Step by Step Answer:

This question has not been answered yet.
You can Ask your question!


Principles Of Econometrics
ISBN: 9781118452271
5th Edition
Authors: R Carter Hill, William E Griffiths, Guay C Lim
