

Consider the share of total household expenditure (TOTEXP) devoted to expenditure on food (FOOD). Specify the log-linear
Question:
Consider the share of total household expenditure (TOTEXP) devoted to expenditure on food (FOOD). Specify the log-linear relationship FOOD/TOTEXP \(=\beta_{1}+\beta_{2} \ln (\) TOTEXP \()\).
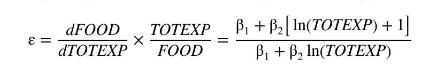
a. Show that the elasticity of expenditure on food with respect to total expenditure is
b. The least squares estimates of the regression model FOOD/TOTEXP \(=\beta_{1}+\beta_{2} \ln (\) TOTEXP \()+e\), using 925 observations from London, are as follows:
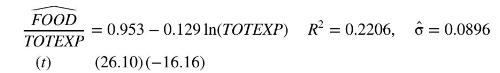
Interpret the estimated coefficient of \(\ln (T O T E X P)\). What happens to the share of food expenditure in the budget as total household expenditures increase?
c. Calculate the elasticity in part (a) at the 5th percentile, and the 75th percentile of total expenditure. Is this a constant elasticity function? The 5th percentile is \(500 \mathrm{UK}\) pounds, and the 75th percentile is 1200 UK pounds.
d. The residuals from the model in (b) have skewness 0.0232 and kurtosis 3.4042. Carry out the Jarque-Bera test at the \(1 \%\) level of significance. What are the null and alternative hypotheses for this test?
e. In FOOD/TOTEXP \(=\beta_{1}+\beta_{2} \ln (\) TOTEXP \()\), take the logarithm of the left-hand side and simplify the result to obtain \(\ln (F O O D)=\alpha_{1}+\alpha_{2} \ln (T O T E X P)\). How are the parameters in this model related to the budget share relation?
f. The least squares estimates of \(\ln (F O O D)=\alpha_{1}+\alpha_{2} \ln (\) TOTEXP \()+e\) are as follows:
Interpret the estimated coefficient of \(\ln (T O T E X P)\). Calculate the elasticity in this model at the 5 th percentile and the 75th percentile of total expenditure. Is this a constant elasticity function?
g. The residuals from the log-log model in (e) show skewness \(=-0.887\) and kurtosis \(=5.023\). Carry out the Jarque-Bera test at the \(5 \%\) level of significance.
h. In addition to the information in the previous parts, we multiply the fitted value in part (b) by TOTEXP to obtain a prediction for expenditure on food. The correlation between this value and actual food expenditure is 0.641. Using the model in part (e) we obtain \(\exp [\widehat{\ln (F O O D)}]\). The correlation between this value and actual expenditure on food is 0.640. What if any information is provided by these correlations? Which model would you select for reporting, if you had to choose only one? Explain your choice. only one? Explain your choice.
Step by Step Answer:


Principles Of Econometrics
ISBN: 9781118452271
5th Edition
Authors: R Carter Hill, William E Griffiths, Guay C Lim
