

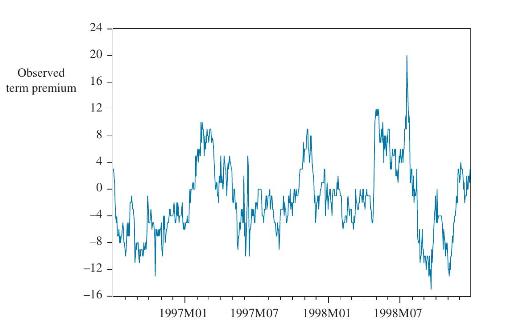
Figure 14.12 shows the daily term premiums between a 180-day bank bill rate and a 90-day bank
Question:
Figure 14.12 shows the daily term premiums between a 180-day bank bill rate and a 90-day bank rate for the period July 1996 to December 1998 (data file term). Preliminary unit root tests confirm that the series may be treated as a stationary series, although the value of \(ho\), the autocorrelation coefficient, is quite high (about 0.9).
a. Estimate a GARCH model and check that you obtain the following results: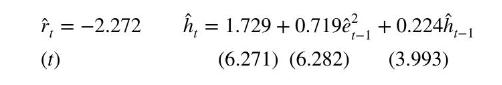
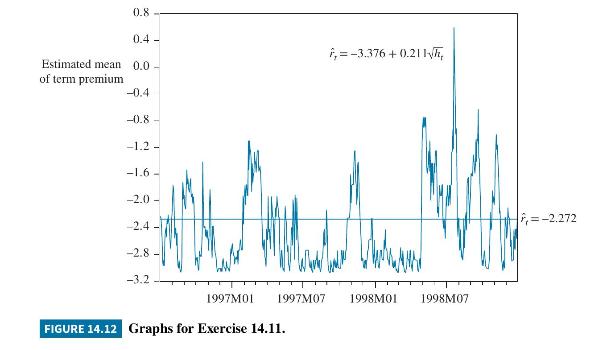
b. Estimate a GARCH-in-mean model and check that you obtain the following results: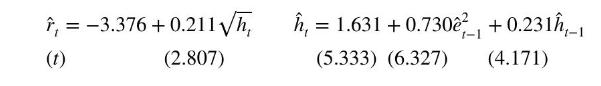 What is the contribution of volatility to the term premium?
c. Is the GARCH-in-mean model better than the GARCH model in a financial econometric sense? Is the GARCH-in-mean model better than the GARCH model in a financial economic sense? A plot of the expected term premium estimated for parts (a) and (b) is shown in Figure 14.12.
Step by Step Answer:

This question has not been answered yet.
You can Ask your question!


Principles Of Econometrics
ISBN: 9781118452271
5th Edition
Authors: R Carter Hill, William E Griffiths, Guay C Lim
