

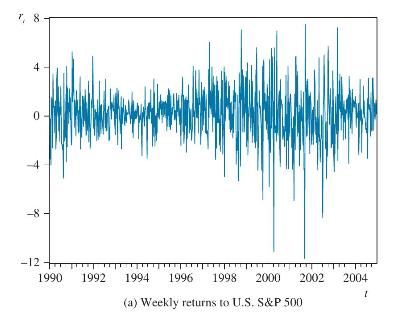
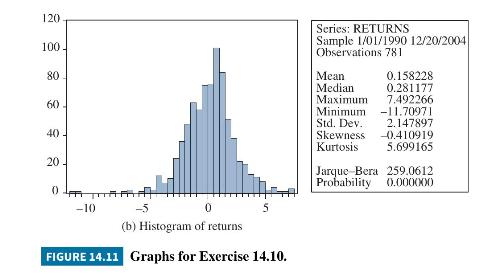
Figure 14.11 shows the weekly returns to the U.S. S&P 500 for the sample period January 1990
Question:
Figure 14.11 shows the weekly returns to the U.S. S\&P 500 for the sample period January 1990 to December 2004 (data file \(s p\) ).
a. Estimate an \(\mathrm{ARCH}(1)\) model and check that you obtain the following results:
\[\begin{array}{cc}\hat{r}_{t}=0.197 & \hat{h}_{t}=3.442+0.253 \hat{e}_{t-1}^{2} \\(t) \quad(2.899) & (22.436)(5.850)\end{array}\]
What is the value of the conditional variance when the last period's shock was positive, \(e_{t-1}=+1\) ? What about when the last period's shock was negative, \(e_{t-1}=-1\) ?
b. Estimate a T-ARCH model and check that you obtain the following results:
\[\begin{array}{cc}\hat{r}_{t}=0.147 & \hat{h}_{t}=3.437+\left(0.123+0.268 d_{t-1}\right) \hat{e}_{t-1}^{2} \\(t) \quad(2.049) & (22.963) \quad(2.330)(2.944)\end{array}\]
c. What is the value of the conditional variance when the last period's shock was positive, \(e_{t-1}=+1\) ? When the last period's shock was negative, \(e_{t-1}=-1\) ?
d. Is the asymmetric T-ARCH model better than the symmetric ARCH model in a financial econometric sense? Is the asymmetric T-ARCH model better than the symmetric ARCH model in a financial economic sense?
Step by Step Answer:


Principles Of Econometrics
ISBN: 9781118452271
5th Edition
Authors: R Carter Hill, William E Griffiths, Guay C Lim
