

The data file euro contains 204 monthly observations on the returns to the Euro share price index
Question:
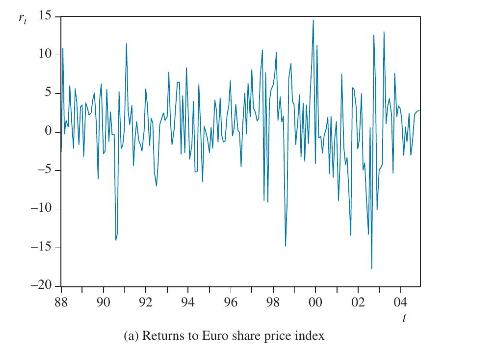
The data file euro contains 204 monthly observations on the returns to the Euro share price index for the period 1988M1 to 2004M12. A plot of the returns data is shown in Figure 14.10(a), together with its histogram in Figure 14.10(b).
a. What do you notice about the volatility of returns? Identify the periods of big changes and the periods of small changes.
b. Is the distribution of returns normal? Is this the unconditional, or conditional, distribution?
c. Perform a LM test for the presence of first-order ARCH and check that you obtain the following results:
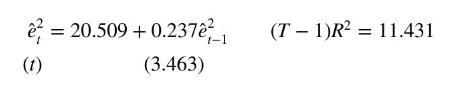
Is there evidence of ARCH effects?
d. Estimate an \(\mathrm{ARCH}(1)\) model and check that you obtain the following results:
\[\begin{array}{cc}\hat{r}_{t}=0.879 & \hat{h}_{t}=20.604+0.230 \hat{e}_{t-1}^{2} \\(t) \quad(2.383) & (10.968)(2.198)\end{array}\]
Interpret the results.
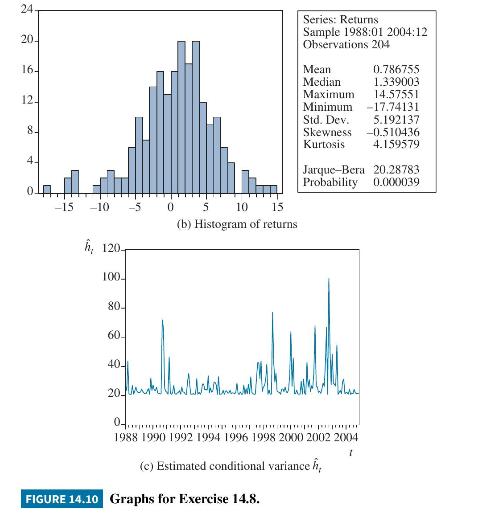
e. A plot of the conditional variance is shown in Figure 14.10(c). Do the periods of high and low conditional variance coincide with the periods of big and small changes in returns?
Step by Step Answer:

This question has not been answered yet.
You can Ask your question!


Principles Of Econometrics
ISBN: 9781118452271
5th Edition
Authors: R Carter Hill, William E Griffiths, Guay C Lim
