

The data file liquor contains observations on annual expenditure on liquor (LIQUOR) and annual income (INCOME), (both
Question:
The data file liquor contains observations on annual expenditure on liquor (LIQUOR) and annual income (INCOME), (both in thousands of dollars) for 40 randomly selected households for three consecutive years.
a. Using the data on INCOME for the first household, calculate the time average, within and differenced observations for INCOME. What is the sum of the within-transformed observations on INCOME for the first household?
b. Consider the panel data regression model LIQUOR \(_{i t}=\beta_{1}+\beta_{2} I N C O M E_{i t}+u_{i}+e_{i t}\) where \(i=1,2, \ldots, 40\) refers to household and \(t=1,2,3\) refers to year. Obtain the OLS estimates of this model.
c. What are the fixed effects estimates of the parameters? What is the sum of squared residuals? Using the sum of squared residuals from the fixed effects estimates and the OLS estimation in (b), test for the presence of individual differences using an \(F\)-test. Show how the test statistic is computed. Using the \(5 \%\) level of significance, what do we conclude?
d. Using OLS, regress LIQUOR on a constant term and 39 individual-specific indicator variables. Save the OLS residuals and call them LIQUORW. Regress INCOME on a constant term and 39 individual-specific indicator variables. Save the residuals and call them INCOMEW. Using OLS regress \(L I Q O U R W\) on INCOMEW without a constant term. What is the estimated coefficient? What is the sum of squared errors? How does this exercise illustrate the Frisch-Waugh-Lovell theorem discussed in Section 5.2.5?
e. Following Example 15.5, show how to correct the standard errors from the regression of LIQOURW on INCOMEW to make them match the fixed effects standard errors.
Data From Example 15.5:-
Consider using the within transformation to the \(T=3\) sales observations in the data file chemical2, from 2004 to 2006, for the 200 firms in Example 15.2, to estimate the effect of changes in the capital stock and labor inputs on sales. The within estimates are
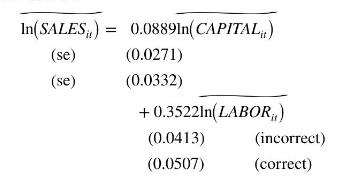
The incorrect standard errors are produced by OLS software using \(N T-2=598\) degrees of freedom when it should be \(N T-N-2=398\). Multiplying the incorrect standard errors by the correction factor
![]()
yields correct standard errors.
Data From Example 15.2:-
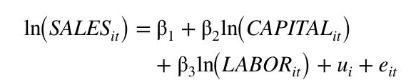
The data file chemical2 contains data on \(N=200\) chemical firms' sales in China for the years 2004-2006. We wish to estimate the log-log model
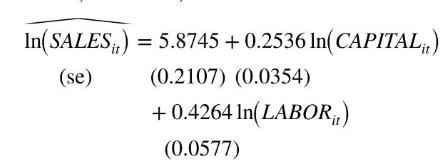
Using only data from 2005 and 2006, the OLS estimates with conventional, nonrobust, standard errors are
We may be concerned that there are unobserved individual differences among the firms that are correlated with their usage of capital and labor in the production and sales process. The estimated first-difference model is
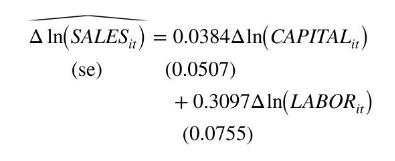
There is a remarkable reduction in the estimated effect of the capital stock, which is no longer statistically significant. The estimated effect of labor is smaller but still significantly different from zero. The difference estimator is consistent when unobserved heterogeneity is correlated with the explanatory variables, but the OLS estimator is not. Given the substantial difference in the estimates we might suspect that the OLS estimates are unreliable.
Step by Step Answer:


Principles Of Econometrics
ISBN: 9781118452271
5th Edition
Authors: R Carter Hill, William E Griffiths, Guay C Lim
