

The data file xrate contains monthly observations from 1986M1 to 2008 M12 on the following variables (^{20})
Question:
The data file xrate contains monthly observations from 1986M1 to 2008 M12 on the following variables \(^{20}\) :
\(N E R=\) the nominal exchange rate for the Australian dollar in terms of U.S. cents.
\(I N F \_A U S=\) the Australian inflation rate.
\(I N F_{-} U S=\) the U.S. inflation rate.
DI6_AUS \(=\) the percentage change in the interest rate on an Australian government debt instrument of maturity 6 months.
\(D I 6 \_U S=\) the percentage change in the interest rate on a U.S. government debt instrument of maturity 6 months.
a. Plot NER against time and examine its correlogram. Does the series wander like a nonstationary series? Do the autocorrelations die out relatively quickly, suggesting a weakly dependent series?
b. Construct a variable which is the monthly change in the exchange rate, \(D N E R_{t}=N E R_{t}-N E R_{t-1}\). Plot DNER against time and examine its correlogram. Does the series wander like a nonstationary series? Do the autocorrelations die out relatively quickly, suggesting a weakly dependent series?
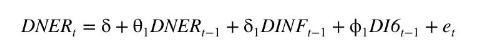
c. Theory suggests that the exchange rate will be higher when Australian inflation is low relative to that in the United States, and when the Australian interest rate is high relative to the U.S. interest rate. Construct the two variables \(D I N F_{t}=I N F_{-} A U S_{t}-I N F_{-} U S_{t}\) and \(D I 6_{t}=D I 6 \_A U S_{t}-D I 6_{-} U S_{t}\), and estimate the model (using HAC standard errors)
![]()
Comment on the results. Do the coefficients have the expected signs? Are they significantly different from zero using one-tail tests and a 5\% significance level?
d. Reestimate the model in part (c), dropping variables whose coefficients had the wrong sign. Are the coefficients in the reestimated model significantly different from zero using one-tail tests and a 5\% significance level? Check for serial correlation in the errors, using both the residual correlogram and an LM test with one lagged residual.
e. Reestimate the model in part (d) using feasible generalized least squares and assuming AR(1) errors. Estimate the model with both conventional and HAC standard errors. Are the coefficients in the reestimated model significantly different from zero using one-tail tests and a 5\% significance level?
f. Suppose that the following model is proposed for 1-month ahead forecasting of the exchange rate
Estimate this model using observations from 1986M1 to 2007M12. Does it appear to be a good model for forecasting?
g. Use the model in part (f) to obtain 1-month ahead forecasts of NER for each of the months in 2008. (Use the actual values of \(D N E R_{t-1}\) to obtain each forecast.) Comment on the accuracy of the forecasts and compute the average absolute forecast error \(\sum_{t=2008 \mathrm{M} 1}^{2008 \mathrm{M} 12}\left|\widehat{N E R}_{t}-N E R_{t}\right| / 12\).
Step by Step Answer:

This question has not been answered yet.
You can Ask your question!


Principles Of Econometrics
ISBN: 9781118452271
5th Edition
Authors: R Carter Hill, William E Griffiths, Guay C Lim
