

In their paper referred to in Exercise 9.31, Apap and Gravino examine the separate effects of output
Question:
In their paper referred to in Exercise 9.31, Apap and Gravino examine the separate effects of output growth in the manufacturing and services sectors on changes in the unemployment rate. Their quarterly data run from 1999Q1 to 2012Q4 and can be found in the data file apap. The variables used in this exercise are \(D U_{t}=U_{t}-U_{t-4}\) (the change in the unemployment rate relative to the same quarter in the previous year), \(M A N_{t}\) (real output growth in the manufacturing sector in quarter \(t\) relative to quarter \(t-4\) ), \(S E R_{t}\) (real output growth in the services sector in quarter \(t\) relative to quarter \(t-4\) ), MAN_WT (the proportion of real output attributable to the manufacturing sector in quarter \(t\) ), and \(S E R_{-} W T_{t}\) (the proportion of real output attributable to the services sector in quarter \(t\) ). The relative effects of growth in each of the sectors on unemployment will depend not only on their growth rates but also on the relative size of each sector in the economy. To recognize this fact, construct the weighted growth variables \(M A N 2_{t}=M A N_{t} \times M A N_{-} W T_{t}\) and \(S E R 2_{t}=S E R_{t} \times S E R_{-} W T_{t}\).
a. Use OLS with HAC standard errors to estimate the model
![]()
Comment on the relative importance of growth in each sector on changes in unemployment and on whether there is a lag in the effect from each sector.
b. Use an LM test with two lags and a 5\% significance level to test for autocorrelation in the errors for the equation in part (a).
c. Assume that the errors in the equation in part (a) follow the \(\mathrm{AR}(1)\) process \(e_{t}=ho e_{t-1}+v_{t}\). Show that, under this assumption, the model can be written as
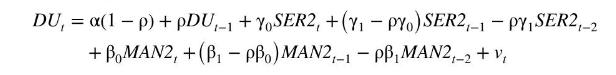
d. Use nonlinear least squares with HAC standard errors to estimate the model in part (c). Have your conclusions made in part (a) changed?
e. Use an LM test with two lags and a 5\% significance level to test for autocorrelation in the errors for the equation in part (d). Is the AR(1) process adequate to model the autocorrelation in the errors of the original equation.
f. Suppose that, wanting to forecast \(D U_{2013 Q 1}\) using current and past information, you set up the model
![]()
i. Have a sufficient number of lags of \(D U\) been included?
ii. Using a 5\% significance level, test whether SER2 Granger causes \(D U\).
iii. Using a 5\% significance level, test whether MAN2 Granger causes \(D U\).
Step by Step Answer:


Principles Of Econometrics
ISBN: 9781118452271
5th Edition
Authors: R Carter Hill, William E Griffiths, Guay C Lim
