

The standard error of the forecast error is (operatorname{se}(f)=) (sqrt{22.4208}=4.7351), and the relevant (t)-value is (t_{(0.975,71)}=) 1.9939
Question:
The standard error of the forecast error is \(\operatorname{se}(f)=\) \(\sqrt{22.4208}=4.7351\), and the relevant \(t\)-value is \(t_{(0.975,71)}=\) 1.9939 , giving a \(95 \%\) prediction interval ofThe standard error of the forecast error is \(\operatorname{se}(f)=\) \(\sqrt{22.4208}=4.7351\), and the relevant \(t\)-value is \(t_{(0.975,71)}=\) 1.9939 , giving a \(95 \%\) prediction interval ofIn Example 6.15 a prediction interval for SALES from Big Andy's Burger Barn was computed for the settings \(P R I C E_{0}=6, A D V E R T_{0}=1.9\). Find point and \(95 \%\) interval estimates for
Contrast your answers with the point and interval predictions that were obtained in Example 6.15.
Data From Example 6.15:-
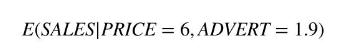
We are concerned with finding a \(95 \%\) prediction interval for SALES at Big Andy's Burger Barn when \(P R I C E_{0}=6\), \(A D V E R T_{0}=1.9\) and \(A D V E R T_{0}^{2}=3.61\). These are the values considered by Big Andy in Example 6.6. In terms of the general notation \(\mathbf{x}_{0}=(1,6,1.9,3.61)\). The point prediction is
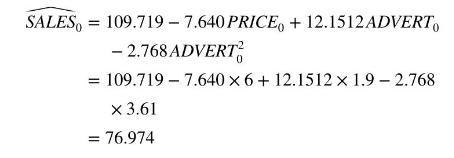
With the settings proposed by Big Andy, we forecast that sales will be \(\$ 76,974\).
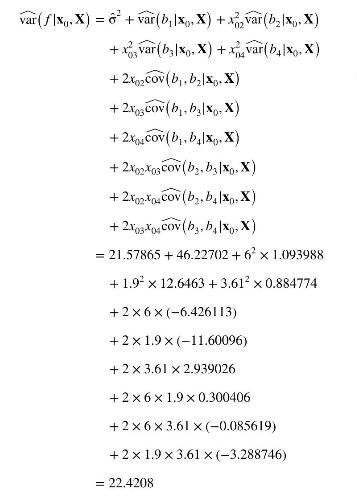
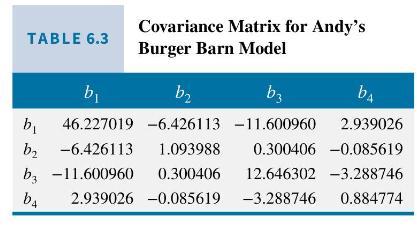
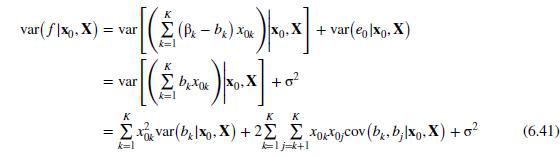
To obtain a prediction interval, we first need to compute the estimated variance of the forecast error. Using equation (6.41) and the covariance matrix values in Table 6.3, we have
The standard error of the forecast error is \(\operatorname{se}(f)=\) \(\sqrt{22.4208}=4.7351\), and the relevant \(t\)-value is \(t_{(0.975,71)}=\) 1.9939 , giving a \(95 \%\) prediction interval of
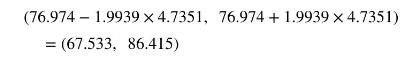
We predict, with 95\% confidence, that Big Andy's settings for price and advertising expenditure will yield SALES between \(\$ 67,533\) and \(\$86,415\).
Data From Equation 6.41:-
Data From Example 6.6:-
Suppose that, instead of wanting to test whether the data supports the conjecture "ADVERT \(=1.9\) is optimal," Big Andy wants to test whether the optimal value of \(A D V E R T\) is greater than 1.9. If he has been spending \(\$ 1900\) per month on advertising, and he does not want to increase this amount unless there is convincing evidence that the optimal amount is greater than \(\$ 1900\), he will set up the hypotheses 
In this case, we can no longer use the \(F\)-test. Using a \(t\)-test instead, your calculations will reveal \(t=0.9676\). The rejection region for a \(5 \%\) significane level is reject \(H_{0}\) if \(t \geq 1.667\). Because \(0.9676
Step by Step Answer:


Principles Of Econometrics
ISBN: 9781118452271
5th Edition
Authors: R Carter Hill, William E Griffiths, Guay C Lim
