

Using 157 weekly observations on sales revenue (SALES) and advertising expenditure (ADV) in millions of dollars for
Question:
Using 157 weekly observations on sales revenue (SALES) and advertising expenditure (ADV) in millions of dollars for a large department store, the following relationship was estimated
![]()
a. How many degrees of freedom are there for this estimated model? (Take into account the observations lost through lagged variables.)
b. Describe the relationship between sales and advertising expenditure. Include an explanation of the lagged relationship. When does advertising have its greatest impact? What is the total effect of a sustained \(\$ 1\) million increase in advertising expenditure?
c. The estimated covariance matrix of the coefficients is
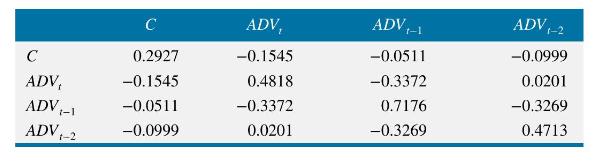
Using a two-tail test and a 5\% significance level, which lag coefficients are significantly different from zero? Do your conclusions change if you use a one-tail test? Do they change if you use a 10\% significance level?
d. Find \(95 \%\) confidence intervals for the impact multiplier, the one-period interim multiplier, and the total multiplier.
Step by Step Answer:


Principles Of Econometrics
ISBN: 9781118452271
5th Edition
Authors: R Carter Hill, William E Griffiths, Guay C Lim
