

Using 250 quarterly observations on U.S. GDP growth ((G)) from 1947Q2 to 2009Q3, we calculate the following
Question:
Using 250 quarterly observations on U.S. GDP growth \((G)\) from 1947Q2 to 2009Q3, we calculate the following quantities.
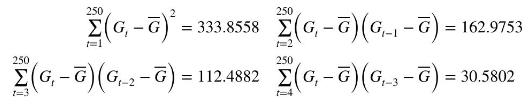
a. Compute the first three autocorrelations \(\left(r_{1}, r_{2}\right.\), and \(\left.r_{3}\right)\) for \(G\). Test whether each one is significantly different from zero at a \(5 \%\) significance level. Sketch the first three bars of the correlogram. Include the significance bounds.
b. Given that \(\sum_{t=2}^{250}\left(G_{t-1}-\bar{G}_{-1}\right)^{2}=333.1119\) and \(\sum_{t=2}^{250}\left(G_{t}-\bar{G}_{1}\right)\left(G_{t-1}-\bar{G}_{-1}\right)=162.974\), where \(\bar{G}_{1}=\) \(\sum_{t=2}^{250} G_{t} / 249=1.662249\) and \(\bar{G}_{-1}=\sum_{t=2}^{250} G_{t-1} / 249=1.664257\), find least squares estimates of \(\delta\) and \(\theta_{1}\) in the \(\operatorname{AR}(1)\) model \(G_{t}=\delta+\theta_{1} G_{t-1}+e_{t}\). Explain the difference between the estimate \(\hat{\theta}_{1}\) and the estimate \(r_{1}\) obtained in part (a).
Step by Step Answer:

This question has not been answered yet.
You can Ask your question!


Principles Of Econometrics
ISBN: 9781118452271
5th Edition
Authors: R Carter Hill, William E Griffiths, Guay C Lim
