

We have 2008 data on INCOME = income per capita (in thousands of dollars) and BACHELOR =
Question:
We have 2008 data on INCOME = income per capita (in thousands of dollars) and BACHELOR = percentage of the population with a bachelor's degree or more for the 50 U.S. States plus the District of Columbia, a total of \(N=51\) observations. The results from a simple linear regression of INCOME on BACHELOR are
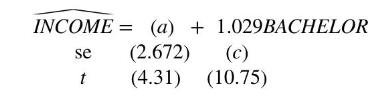
a. Using the information provided calculate the estimated intercept. Show your work.
b. Sketch the estimated relationship. Is it increasing or decreasing? Is it a positive or inverse relationship? Is it increasing or decreasing at a constant rate or is it increasing or decreasing at an increasing rate?
c. Using the information provided calculate the standard error of the slope coefficient. Show your work.
d. What is the value of the \(t\)-statistic for the null hypothesis that the intercept parameter equals 10?
e. The \(p\)-value for a two-tail test that the intercept parameter equals 10 , from part (d), is 0.572. Show the \(p\)-value in a sketch. On the sketch, show the rejection region if \(\alpha=0.05\).
f. Construct a \(99 \%\) interval estimate of the slope. Interpret the interval estimate.
g. Test the null hypothesis that the slope coefficient is one against the alternative that it is not one at the \(5 \%\) level of significance. State the economic result of the test, in the context of this problem.
Step by Step Answer:

This question has not been answered yet.
You can Ask your question!


Principles Of Econometrics
ISBN: 9781118452271
5th Edition
Authors: R Carter Hill, William E Griffiths, Guay C Lim
