

Question: The following figure shows a scatterplot with a regression line. The data are for the 50 states. The predictor is the percentage of adults who
The following figure shows a scatterplot with a regression line. The data are for the 50 states. The predictor is the percentage of adults who smoke. The response is the percentage of high school students who smoke. (The point in the lower left is Utah.)
a. Explain what the trend shows.
b. Use the regression equation to predict the percentage of high school students who smoke, assuming that 25% of adults in the state smoke. Use 25, not 0.25.
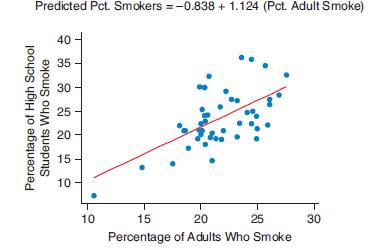
Predicted Pct. Smokers =-0.838 + 1.124 (Pct. Adult Smoke) 40 35 30 25 20 15 10 10 15 20 25 30 Percentage of Adults Who Smoke Percentage of High School Students Who Smoke
Step by Step Solution
3.41 Rating (157 Votes )
There are 3 Steps involved in it
a Explain what the trend shows The scatterplot with the regression line displays the relationship be... View full answer

Get step-by-step solutions from verified subject matter experts