

Question: The following figure shows a scatterplot with the regression line. The data are for the 50 states. The predictor is the percentage of smokefree homes.
The following figure shows a scatterplot with the regression line. The data are for the 50 states. The predictor is the percentage of smokefree homes. The response is the percentage of high school students who smoke. The data came from the Centers for Disease Control and Prevention.
a. Explain what the trend shows.
b. Use the regression equation to predict the percentage of students in high school who smoke, assuming that there are 70% smoke-free homes in the state. Use 70 not 0.70.
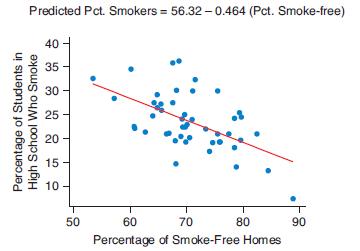
Predicted Pct. Smokers = 56.32 - 0.464 (Pct. Smoke-free) 40 35 30 25 20 - 15 10 - 50 60 70 80 90 Percentage of Smoke-Free Homes Percentage of Students in High School Who Smoke
Step by Step Solution
3.45 Rating (168 Votes )
There are 3 Steps involved in it
a The trend in the scatterplot shows a negative relationship between the ... View full answer

Get step-by-step solutions from verified subject matter experts