

Question: The gure shows a scatterplot with the regression line. The equation of the regression line is shown below. The data are for the 50 regions
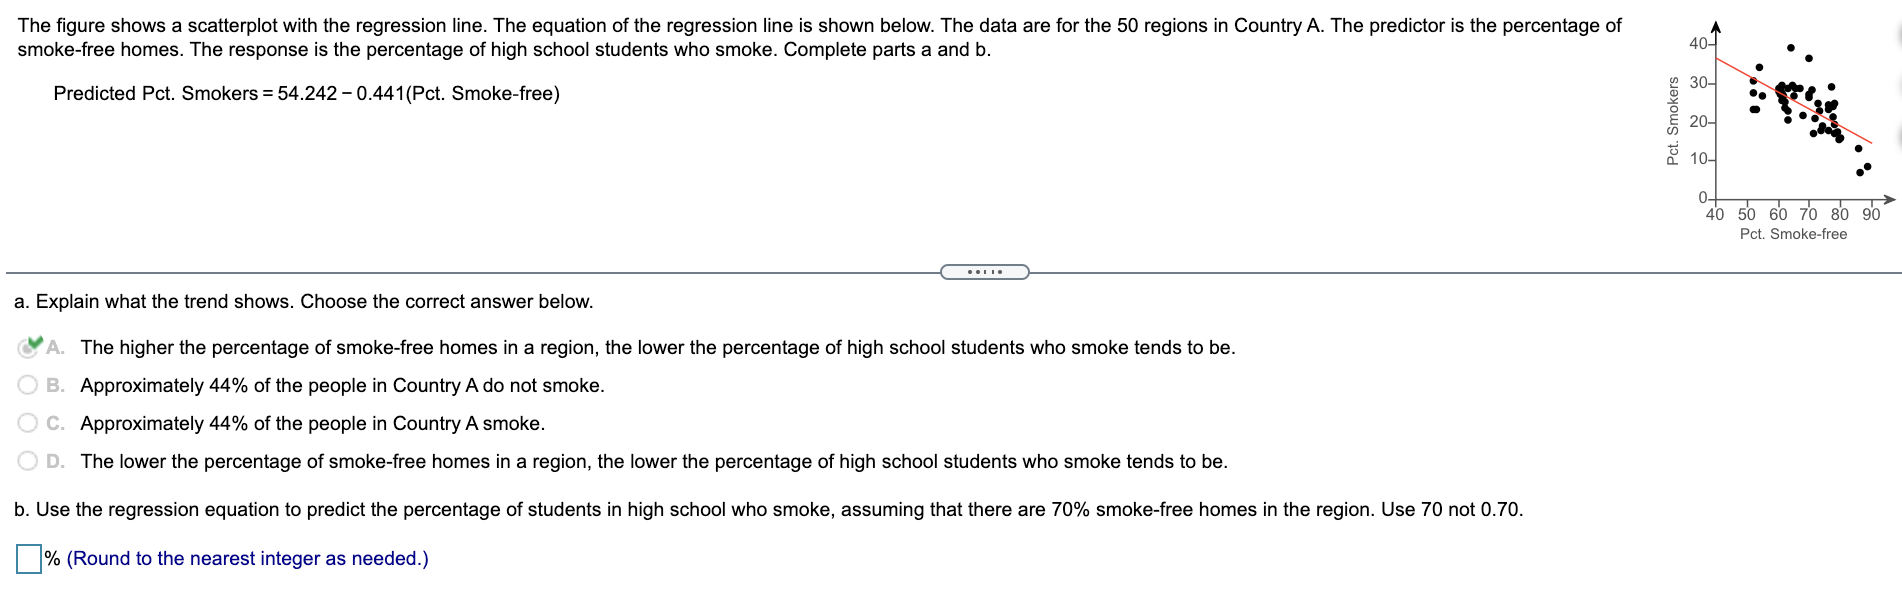
The gure shows a scatterplot with the regression line. The equation of the regression line is shown below. The data are for the 50 regions in Country A. The predictor is the percentage of smoke-free homes. The response is the percentage of high school students who smoke. Complete parts a and b. Predicted Pct. Smokers = 54.242 0.441 (Pct. Smoke-free) Pct. Smokers 4D 50 60 70 ED 90 Pct. Smoke-tree a. Explain what the trend shows. Choose the correct answer below. .VA. The higher the percentage of smoke-free homes in a region, the lower the percentage of high school students who smoke tends to be. B. Approximately 44% of the people in CountryAdo not smoke. C. Approximately 44% of the people in CountryAsmoke. D. The lower the percentage of smoke-free homes in a region, the lower the percentage of high school students who smoke tends to be. b. Use the regression equation to predict the percentage of students in high school who smoke, assuming that there are 70% smoke-tree homes in the region. Use 70 not 0.70. I: % (Round to the nearest integer as needed.)
Step by Step Solution
There are 3 Steps involved in it

Get step-by-step solutions from verified subject matter experts