

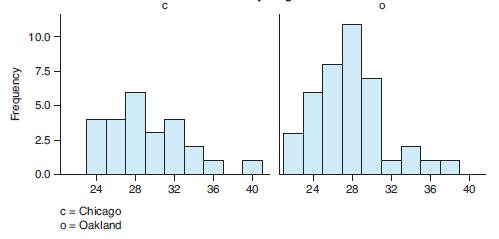
The following histograms show the ages of professional baseball players for two teams: the Chicago Cubs and
Question:
The following histograms show the ages of professional baseball players for two teams: the Chicago Cubs and the Oakland Athletics.
a. Describe the shape of each histogram.
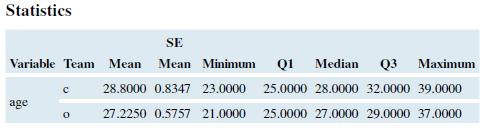
b. Because of the shapes, which measures of center should be compared: the means or the medians?
c. Because of the shapes, which measures of spread should be compared: the standard deviations or the interquartile ranges?
d. Use the appropriate measures to compare the distributions of player ages.
Fantastic news! We've Found the answer you've been seeking!
Step by Step Answer:
a Both histograms are right skewed because in both cases median is less than the mean and ...View the full answer

Answered By
Sreelekshmi U
I have more than 1 and a half year experience in online tutoring in chegg and coursehero. I like to provide answers with clear explanations.
0 Reviews
10+ Question Solved
Related Book For 

Introductory Statistics Exploring The World Through Data
ISBN: 9780135163146
3rd Edition
Authors: Robert Gould, Rebecca Wong, Colleen N. Ryan
Question Posted:
