

The following table gives the distance from Boston to each city and the cost of a train
Question:
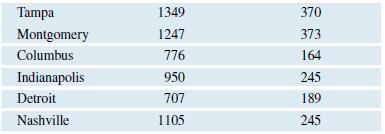
The following table gives the distance from Boston to each city and the cost of a train ticket from Boston to that city for a certain date.
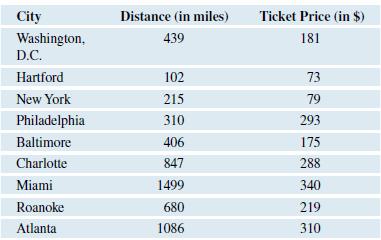
a. Use technology to produce a scatterplot. Based on your scatterplot do you think there is a strong linear relationship between these two variables? Explain.
b. Compute r and write the equation of the regression line. Use the words “Ticket Price” and “Distance” in your equation. Round off to two decimal places.
c. Provide an interpretation of the slope of the regression line.
d. Provide an interpretation of the y-intercept of the regression line or explain why it would not be appropriate to do so.
e. Use the regression equation to predict the cost of a train ticket from Boston to Pittsburgh, a distance of 572 miles.
Step by Step Answer:
To answer these questions well first need to compute the correlation coefficient r and perform linea...View the full answer


Introductory Statistics Exploring The World Through Data
ISBN: 9780135163146
3rd Edition
Authors: Robert Gould, Rebecca Wong, Colleen N. Ryan
