

The following table shows a random sample of 50 quantitative SAT scores of first-year students admitted at
Question:
The following table shows a random sample of 50 quantitative SAT scores of first-year students admitted at a university. Make an appropriate graph of the distribution of the data, pose a statistical question, and describe the distribution.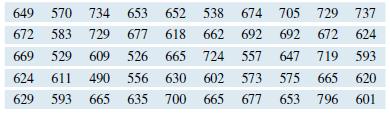
Fantastic news! We've Found the answer you've been seeking!
Step by Step Answer:
To make an appropriate graph we have to count the frequencies of the SAT scores a...View the full answer

Answered By
Sajjad moradian
I am early tutor students of class plus one and plus two in my home
0 Reviews
10+ Question Solved
Related Book For 

Introductory Statistics Exploring The World Through Data
ISBN: 9780135163146
3rd Edition
Authors: Robert Gould, Rebecca Wong, Colleen N. Ryan
Question Posted:
