

The following table shows the gas tax (in cents per gallon) in each of the western U.S.
Question:
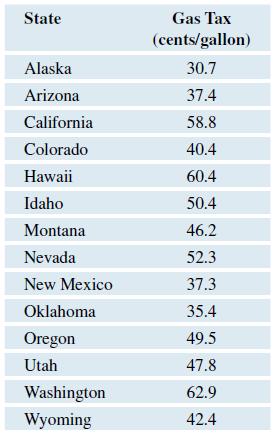
The following table shows the gas tax (in cents per gallon) in each of the western U.S. states.
a. Find and interpret the median gas tax using a sentence in context.
b. Find and interpret the interquartile range.
c. What is the mean gas tax?
d. Note that the mean and the median for this data set are very similar. What does this indicate about the shape of the data? Make a graph of the data and discuss the shape of the data.
Fantastic news! We've Found the answer you've been seeking!
Step by Step Answer:
To analyze the gas tax data a To find the median gas tax we first need to arrange the gas tax values in ascending order 307 354 373 374 404 424 462 47...View the full answer

Answered By
Utsab mitra
I have the expertise to deliver these subjects to college and higher-level students. The services would involve only solving assignments, homework help, and others.
I have experience in delivering these subjects for the last 6 years on a freelancing basis in different companies around the globe. I am CMA certified and CGMA UK. I have professional experience of 18 years in the industry involved in the manufacturing company and IT implementation experience of over 12 years.
I have delivered this help to students effortlessly, which is essential to give the students a good grade in their studies.
2+ Reviews
10+ Question Solved
Related Book For 

Introductory Statistics Exploring The World Through Data
ISBN: 9780135163146
3rd Edition
Authors: Robert Gould, Rebecca Wong, Colleen N. Ryan
Question Posted:
