

Question: The scatterplot shows the average teacher pay and the per pupil expenditure for each of the 50 states and the District of Columbia. The regression
The scatterplot shows the average teacher pay and the per pupil expenditure for each of the 50 states and the District of Columbia. The regression equation is also shown.
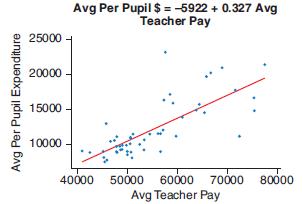
a. From the scatterplot is the correlation between average teacher pay and per pupil expenditure positive, negative, or near zero?
b. What is the slope of the regression equation? Interpret the slope in the context of the problem.
c. What is the y-intercept of the regression equation? Interpret the y-intercept or explain why it would be inappropriate to do so for this problem.
d. Use the regression equation to estimate the per pupil expenditure for a state with an average teacher pay of $60,000.
Avg Per Pupil $ = -5922 + 0.327 Avg Teacher Pay 25000 20000 15000 10000 50000 60000 Avg Teacher Pay 40000 70000 80000 Avg Per Pupil Expenditure
Step by Step Solution
3.45 Rating (174 Votes )
There are 3 Steps involved in it
a From the scatterplot the correlation between average teacher pay and per pupil expenditure appears ... View full answer

Get step-by-step solutions from verified subject matter experts