

Question: The accompanying scatterplot shows the average teacher pay and the per pupil expenditure for 45 states out of the 50 states and the District of
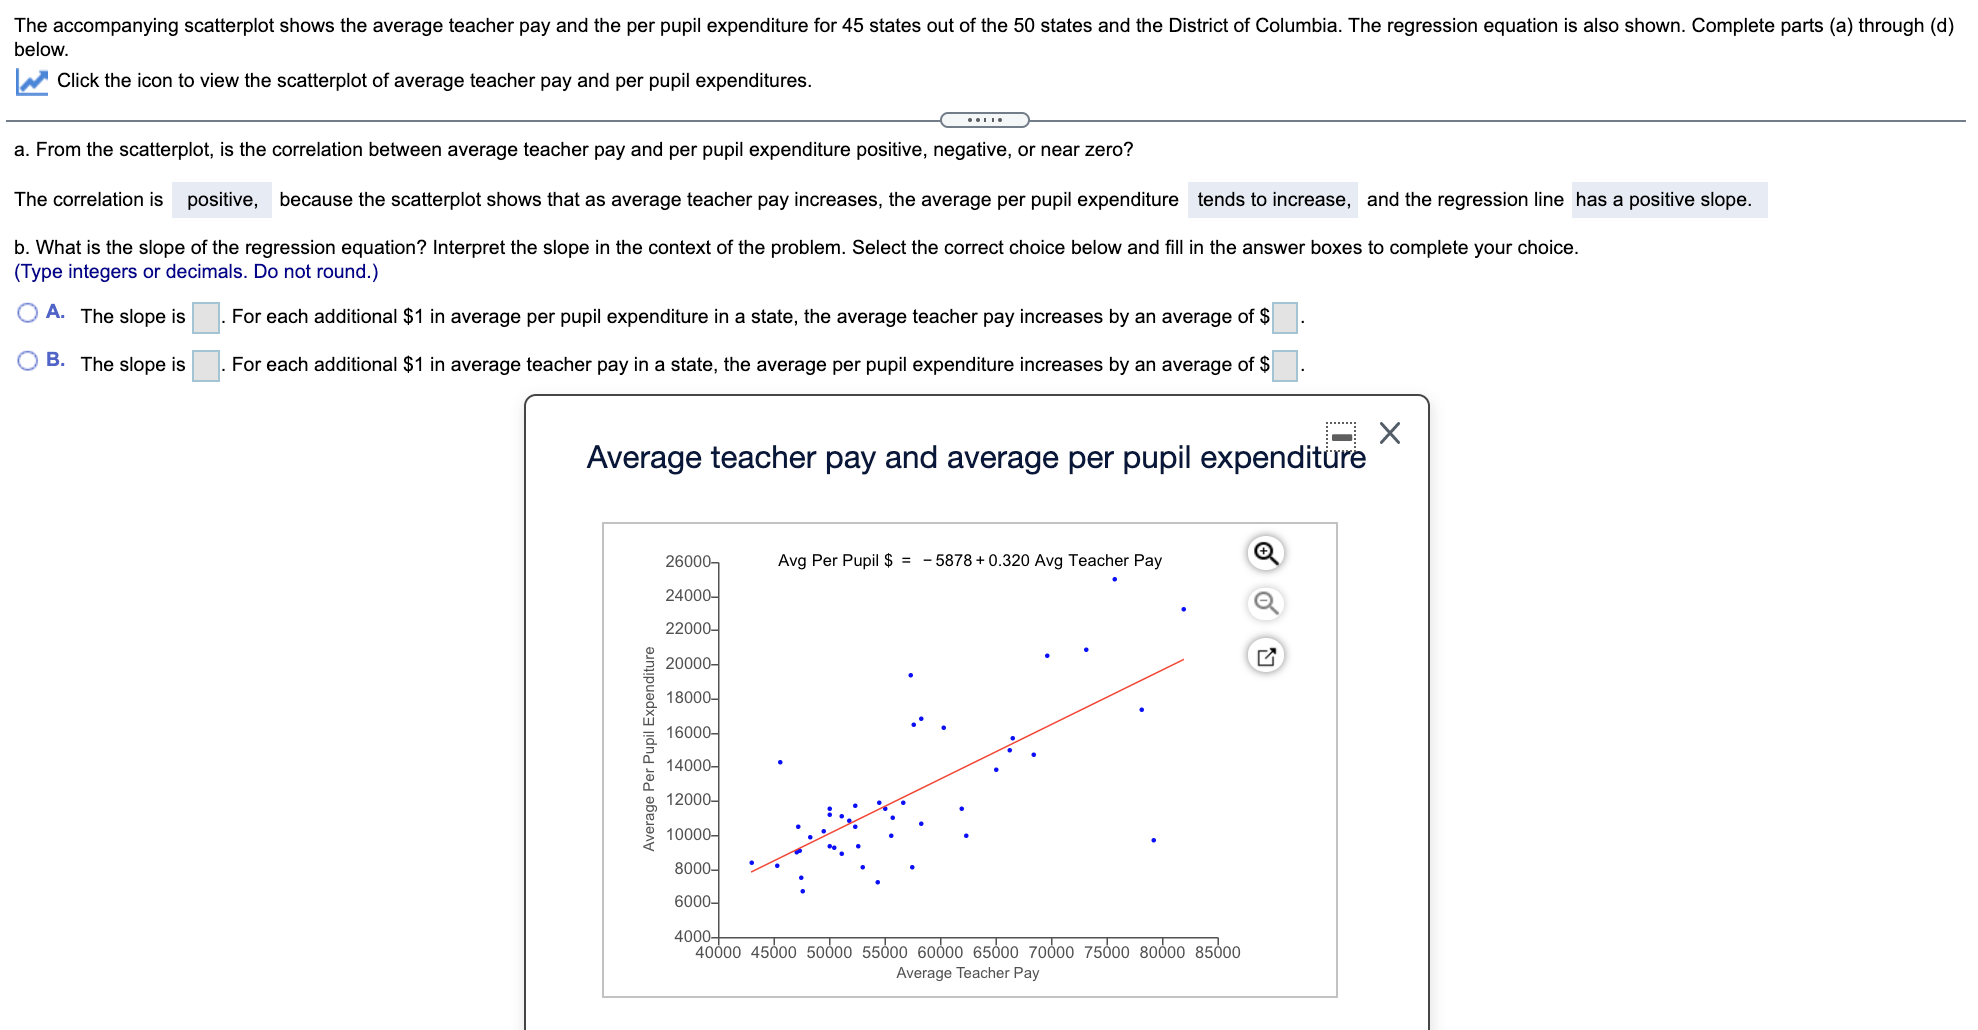

The accompanying scatterplot shows the average teacher pay and the per pupil expenditure for 45 states out of the 50 states and the District of Columbia. The regression equation is also shown. Complete parts (a) through (0} below. K Click the icon to view the scatterplot of average teacher pay and per pupil expenditures. a. From the scatterplot, is the correlation between average teacher pay and per pupil expenditure positive, negative. or near zero? The correlation is positive, because the scatterplot shows that as average teacher pay increases, the average per pupil expenditure tends to increase, and the regression line has a positive slope. b. What is the slope of the regression equation? Interpret the slope in the context of the problem. Select the correct choice below and ll in the answer boxes to complete your choice. (Type integers or decimals. Do not round.) O A- The slope is . For each additional $1 in average per pupil expenditure in a state, the average teacher pay increases by an average of $ O B- The slope is . For each additional $1 in average teacher pay in a state, the average per pupil expenditure increases by an average of $ Average teacher pay and average per pupil expenditure 2600 Avg Per Pupil $ = - 5873 + 0.1120 Avg Teacher Pay Q Average Per Pupil Expenditure 40000 45000 50000 55000 60000 65000 70000 75000 30000 05000 Average Teacher Pay
Step by Step Solution
There are 3 Steps involved in it

Get step-by-step solutions from verified subject matter experts