

Technical analysts look for patterns in stock prices that can be exploited. Figure 123 shows 30 days
Question:
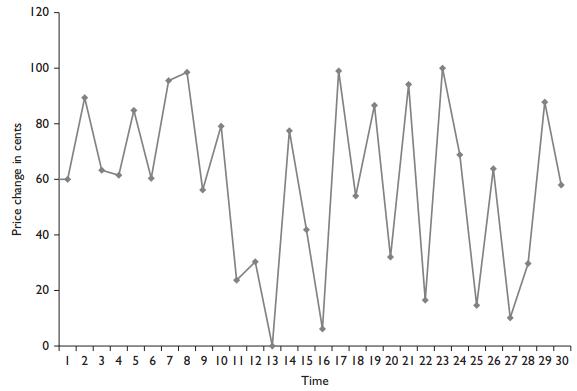
Technical analysts look for patterns in stock prices that can be exploited. Figure 12‐3 shows 30 days of price changes for Botox Company. Notice that in every case but one, whenever the price change is less than 20 cents, the next price change is strongly positive. Furthermore, whenever the price change is above 80 cents, the next price change is almost always lower. Is this a successful example of using past price information to predict future price changes?
The answer is NO! The changes in Figure 12‐3 were generated by the random number generator function in Excel. This illustrates the danger of trying to find useful patterns in stock prices.
Figure 12‐3
Step by Step Answer:


Investments Analysis And Management
ISBN: 9781118975589
13th Edition
Authors: Charles P. Jones, Gerald R. Jensen
