

Question: Consider each table below. Is the data presented consistent with the Phillips curve model of wage determination? Each table has a point (A) and a
Consider each table below. Is the data presented consistent with the Phillips curve model of wage determination? Each table has a point \(A\) and a point B. Startyour answer with true/false/ uncertain.
a. The natural rate of unemployment is \(5 \%\).
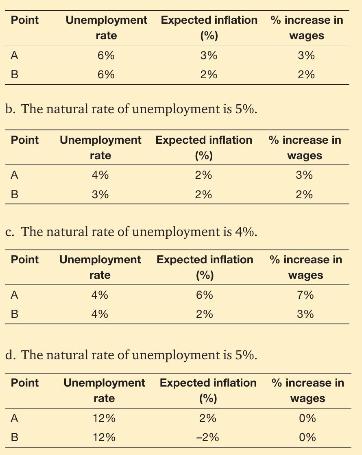
Point Unemployment Expected inflation Expected inflation % increase in rate (%) wages A B 6% 6% 3% 3% 2% 2% b. The natural rate of unemployment is 5%. Point Unemployment Expected inflation % increase in rate A 4% B 3% (%) 2% 2% wages 3% 2% c. The natural rate of unemployment is 4%. Point Unemployment Expected inflation % increase in rate AB A 4% 4% (%) 6% 2% wages 7% 3% d. The natural rate of unemployment is 5%. Point Unemployment Expected inflation % increase in rate (%) wages A 12% 2% 0% B 12% -2% 0%
Step by Step Solution
3.31 Rating (148 Votes )
There are 3 Steps involved in it
Lets applying the Phillips curve concept of wage determination Background on the Phillips Curve and Wage Determination The Phillips curve suggests an inverse relationship between unemployment and infl... View full answer

Get step-by-step solutions from verified subject matter experts