

The estimated Phillips curve from Figure 8.5 is: [pi_{t}=2.8 %-0.16 u_{t}] Fill in the table below using
Question:
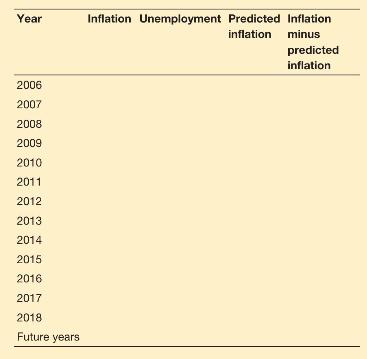
The estimated Phillips curve from Figure 8.5 is: \[\pi_{t}=2.8 \%-0.16 u_{t}\]
Fill in the table below using the Phillips curve above after collecting the data from the FRED database. The monthly series are UNRATE, the unemployment rate and CPIAVCSL, the consumer price index. FRED allows you to download annual averages of these series. You will need to construct the inflation rate as the percentage change in the annual level of the CPI. You might choose to use a spreadsheet. Then answer the questions.
a. Assess the ability of the Phillips curve to predict inflation over the time period after 2006. What is the average prediction error?
b. Assess the ability of the Phillips curve to predict inflation during the crisis years 2009 and 2010? What do you think may be going on?
c. You will be able to add years after 2018 to your table. Assess the ability of the expectations augmented Phillips curve estimated with the data ending in 2018 to predict inflation after 2018.
Step by Step Answer:


Macroeconomics A European Perspective
ISBN: 9781292360898
4th Edition
Authors: Olivier Blanchard, Alessia Amighini, Francesco Giavazzi
