

Fill in the values in the table below for inflation and expected inflation using the 1960s. The
Question:
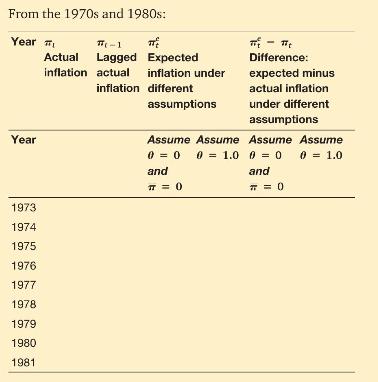
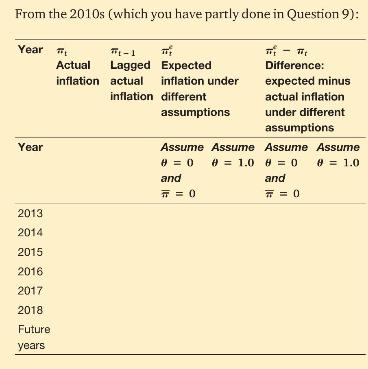
Fill in the values in the table below for inflation and expected inflation using the 1960s. The data will come from FRED as they did in the last question. You will have the most success using a spreadsheet.
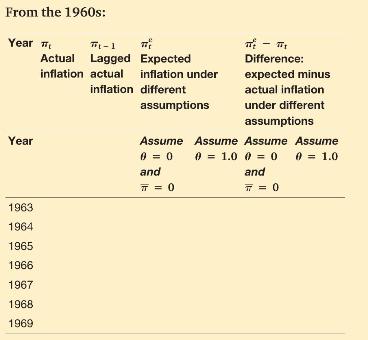
a. Is zero a good choice for the value of \(\theta\) in the 1960s? Is \(\bar{\pi}=0\) a good choice for a value of \(\bar{\pi}\) ? How are you making these judgements?
b. Is 1 a good choice for the value of \(\theta\) in the 1960s? How are you making that judgement?
c. Is zero a good choice for the value of \(\theta\) or \(\bar{\pi}\) in the 1970s? How are you making that judgement?
d. Is 1 a good choice for the value of \(\theta\) in the 1970s? How are you making that judgement?
e. How does the model where the anchored rate of inflation is \(2 \%\) fit the data after 2012 ? How are you making that judgement?
f. Is 1 a good choice for the value of \(\theta\) in the 2010s? How are you making that judgement?
g. How do you compare the behaviour of inflation, its average level, and its persistence across these three time periods?
Step by Step Answer:


Macroeconomics A European Perspective
ISBN: 9781292360898
4th Edition
Authors: Olivier Blanchard, Alessia Amighini, Francesco Giavazzi
