

Transparency International constructs the Corruption Perception Index (CPI), meant to measure the perceived level of public-sector corruption
Question:
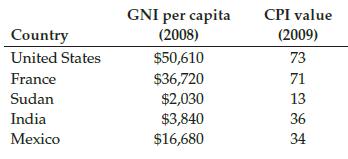
Transparency International constructs the Corruption Perception Index (CPI), meant to measure “the perceived level of public-sector corruption in 180 countries and territories around the world.” The CPI ranges from 0 (most corrupt) to 100 (least corrupt). Plot the CPI values for these selected countries and their per capita Gross National Income (GNI). Can you explain the trend you observe in the graph?
Step by Step Answer:

This question has not been answered yet.
You can Ask your question!
Related Book For 

Question Posted:
