

Question: Look back at Table 4.3. Why do such large differences in capital lead to relatively small differences in predicted GDP across countries? TABLE 4.3 The
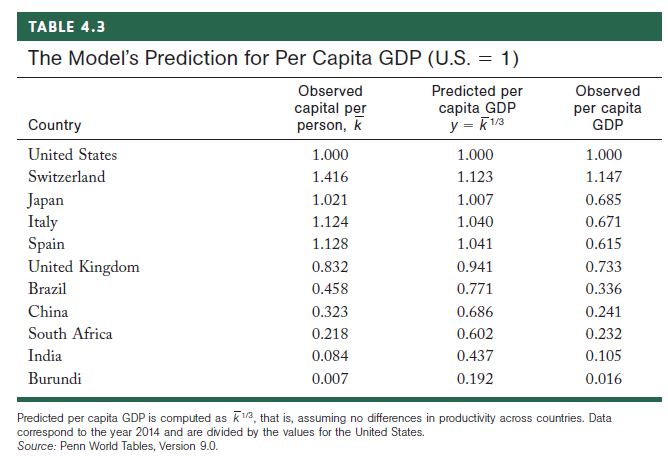
TABLE 4.3 The Model's Prediction for Per Capita GDP (U.S. = 1) %3D Predicted per capita GDP y = K13 Observed capital per person, k Observed per capita GDP Country United States 1.000 1.000 1.000 Switzerland 1.416 1.123 1.147 Japan Italy Spain United Kingdom 1.007 0.685 1.021 1.124 0.671 1.040 1.128 1.041 0.615 0.832 0.941 0.733 Brazil 0.458 0.771 0.336 China 0.323 0.686 0.241 South Africa 0.218 0.602 0.232 India 0.105 0.084 0.437 Burundi 0.007 0.192 0.016 Predicted per capita GDP is computed as k3, that is, assuming no differences in productivity across countries. Data correspond to the year 2014 and are divided by the values for the United States. Source: Penn World Tables, Version 9.0.
Step by Step Solution
3.50 Rating (177 Votes )
There are 3 Steps involved in it
Capital differences really are huge across countries bu... View full answer

Get step-by-step solutions from verified subject matter experts