

The accompanying table shows the relationship between workers hours of work per week and their hourly wage
Question:
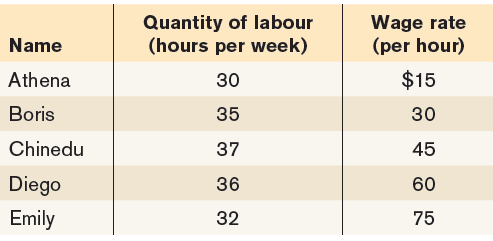
a. Which variable is the independent variable? Which is the dependent variable?
b. Draw a scatter diagram illustrating this relationship. Draw a (non-linear) curve that connects the points. Put the hourly wage rate on the vertical axis.
c. As the wage rate increases from $15 to $30, how does the number of hours worked respond according to the relationship depicted here? What is the average slope of the curve between Athena€™s and Boris€™s data points using the arc method?
d. As the wage rate increases from $60 to $75, how does the number of hours worked respond according to the relationship depicted here? What is the average slope of the curve between Diego€™s and Emily€™s data points using the arc method?
Step by Step Answer:
a if the wage rate is greater than your opportunity cost of time you will choose to wor...View the full answer


Macroeconomics
ISBN: 978-1319120054
3rd Canadian edition
Authors: Paul Krugman, Robin Wells, Iris Au, Jack Parkinson
