

The following graph represents the market for wheat. The equilibrium price is $20 per bushel and the
Question:
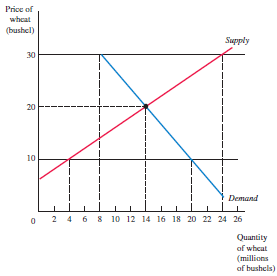
a. Explain what will happen if the government establishes a price ceiling of $10 per bushel of wheat in this market? What if the price ceiling was set at $30?
b. Explain what will happen if the government establishes a price floor of $30 per bushel of wheat in this market. What if the price floor was set at $10?
Fantastic news! We've Found the answer you've been seeking!
Step by Step Answer:
a If a price ceiling is set at 10 per bushel the market price would not be able to rise to its equil...View the full answer

Answered By
PALASH JHANWAR
I am a Chartered Accountant with AIR 45 in CA - IPCC. I am a Merit Holder ( B.Com ). The following is my educational details.
PLEASE ACCESS MY RESUME FROM THE FOLLOWING LINK: https://drive.google.com/file/d/1hYR1uch-ff6MRC_cDB07K6VqY9kQ3SFL/view?usp=sharing
3+ Reviews
10+ Question Solved
Related Book For 

Principles of Macroeconomics
ISBN: 978-0134078809
12th edition
Authors: Karl E. Case, Ray C. Fair, Sharon E. Oster
Question Posted:
