The figure below shows an economy that begins in long-run equilibrium with money supply at ($350) billion
Question:
The figure below shows an economy that begins in long-run equilibrium with money supply at \($350\) billion and real GDP equal to Y* at \($1200\) billion. The money demand curve is MD0 the aggregate demand curve is AD0 the aggregate supply curve is AS0 and the price level is equal to 100.
Assume that Y* is unaffected by changes in the nation’s money supply (i.e., there is no hysteresis).
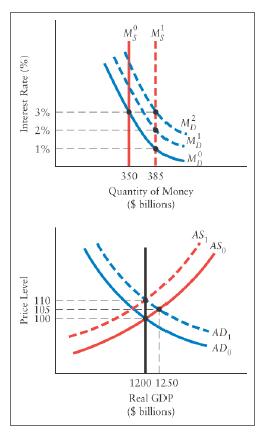
a. Suppose the central bank increases the money supply to \($385\) billion. What is the initial effect of the central bank’s action before any changes in the price level and real GDP occur?
b. Once the economy’s short-run adjustments have occurred, what are the levels of real GDP, the price level, and the interest rate? Explain which curves are shifting, and why.
c. In the short-run equilibrium from part (b), what output gap exists, if any? What starts happening to factor prices, and why?
d. Describe the economy’s adjustment process to its new long-run equilibrium. What curves are shifting, and why?
e. After wages and other factor prices have fully adjusted, what are the new levels of real GDP, the price level, and the interest rate?
f. Was the increase in the money supply neutral in the short run? Explain.
g. Was the increase in the money supply neutral in the long run? Explain. What has been the long-run change in the real money supply?
Step by Step Answer: