

The American Psychological Association (APA) compiles many statistics about training and careers in the field of psychology.
Question:
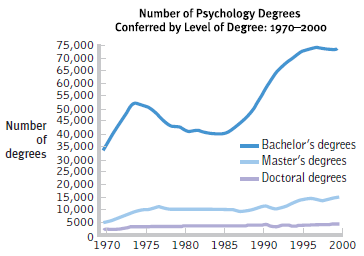
a. What kind of graph is this? Why did th e researchers choose this type of graph?
b. Briefly summarize the overall story being told by this graph.
c. What are the independent and dependent variables depicted in the graph? What kind of variables are they? If nominal or ordinal, what are the levels?
d. List at least three things that the graph creators did well (that is, in line with the guidelines for graph construction).
e. List at least one thing that the graph creators should have done differently (that is, not in line with the guidelines for graph construction).
f. Name at least one variable other than number that might be used to track the prevalence of psychology bachelor€™s, mast er€™s, and doctoral degrees over time.
g. The increase in bachelor€™s degrees over the years is not matched by an increase in doctoral degrees. List at least one research question that this finding suggests to you.
Step by Step Answer:
a This is a time plot The researchers chose this type of graph because they wanted to show changes i...View the full answer


Essentials Of Statistics For The Behavioral Sciences
ISBN: 9781464107771
3rd Edition
Authors: Susan A. Nolan
