

U.S. universities are concerned with increasing the percentage of alumni who donate to the school because alumni
Question:
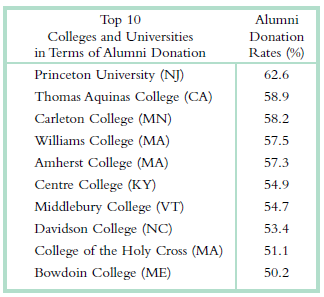
a. What is the independent variable in this example? Is it nominal or scale? If nominal, what are the levels? If scale, what are the units and what are the minimum and maximum values?
b. What is the dependent variable in this example? Is it nominal or scale? If nominal, what are the levels? If scale, what are the units and what are the minimum and maximum values?
c. Construct a bar graph of these data, with one bar for each of the top 10 schools, using the default options in your computer software.
d. Construct a second bar graph of these data, but change the defaults to satisfy the guidelines for graphs discussed in this chapter. Aim for simplicity and clarity.
e. Cite at least one research question that you might want to explore next if you worked for one of these universities. Your research question should grow out of these data.
f. Explain how these data could be presented as a pictorial graph. (Note that you do not have to construct such a graph.) What kind of picture could you use? What would it look like?
g. What are the potential pitfalls of a pictorial graph? Why is a bar chart usually a better choice?
Step by Step Answer:
a The independent variable is the academic institution It is nominal the levels are the 10 colleges ...View the full answer


Essentials Of Statistics For The Behavioral Sciences
ISBN: 9781464107771
3rd Edition
Authors: Susan A. Nolan
