

Question: Consider Figure 4.11, which shows the sensitivity report for the Flair Furniture example in Section 4.3. For each of the situations described below, check to
Consider Figure 4.11, which shows the sensitivity report for the Flair Furniture example in Section 4.3. For each of the situations described below, check to see if the 100% rule can be used to determine the impact of the simultaneous changes described. If so, compute the total change in profit. Each question is independent of the other questions.
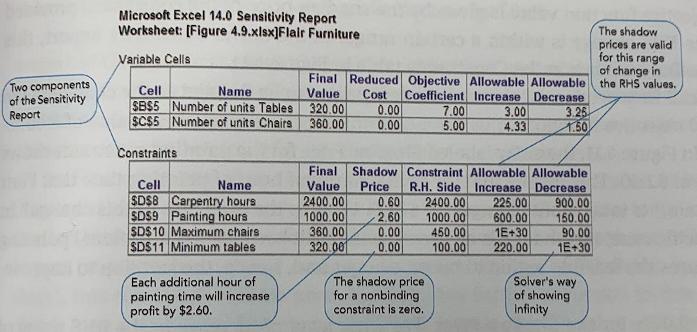
Figure 4.11
(a) Carpentry hours increase by 50, and painting hours increase by 400.
(b) The maximum tables decrease by 70, and painting hours increase by 100.
(c) The maximum chairs decrease by 100, and the maximum tables increase by 100.
(d) Carpentry hours decrease by 100, and painting hours decrease by 300.
(e) The profit contribution of chairs increases by $2.00 per unit, and maximum chairs allowed increases by 30.
(f) The profit contribution of chairs decreases by $1.00 per unit, and the profit contribution of tables increases by $2.00 per unit.
Two components of the Sensitivity Report Microsoft Excel 14.0 Sensitivity Report Worksheet: [Figure 4.9.xlsx]Flair Furniture Variable Cells Cell Name SBS5 Number of units Tables SCS5 Number of units Chairs Constraints Cell Name SDS8 Carpentry hours SDS9 Painting hours SD$10 Maximum chairs SDS11 Minimum tables Each additional hour of painting time will increase. profit by $2.60. Final Reduced Objective Allowable Allowable Value Cost Coefficient Increase Decrease 320.00 360.00 0.00 0.00 7.00 5.00 The shadow price for a nonbinding constraint is zero. 3.00 4.33 Final Shadow Constraint Allowable Allowable Value Price R.H. Side Increase Decrease 2400.00 0.60 2400.00 225.00 2.60 1000.00 600.00 1000.00 360.00 0.00 450.00 320.00 0.00 100.00 3.25 1.50 1E+30 220.00 900.00 150.00 90.00 1E+30 Solver's way of showing Infinity The shadow prices are valid for this range of change in the RHS values.
Step by Step Solution
3.44 Rating (151 Votes )
There are 3 Steps involved in it
To use the 100 rule we need to make sure that all changes are within their allowable range as given in the sensitivity report If this condition is sat... View full answer

Get step-by-step solutions from verified subject matter experts