Question: Consider Figure 4.11, which shows the sensitivity report for the Flair Furniture example in Section 4.3. For each of the situations described below, check to
Consider Figure 4.11, which shows the sensitivity report for the Flair Furniture example in Section 4.3.
For each of the situations described below, check to see if the 100% rule can be used to determine the impact of the simultaneous changes described. If so, compute the total change in profit.
Each question is independent of the other questions.
(a) Carpentry hours increase by 50, and painting hours increase by 400.
(b) The maximum tables decrease by 70, and painting hours increase by 100.
(c) The maximum chairs decrease by 100, and the maximum tables increase by 100.
(d) Carpentry hours decrease by 100, and painting hours decrease by 300.
(e) The profit contribution of chairs increases by $2.00 per unit, and maximum chairs allowed increases by 30.
(f) The profit contribution of chairs decrease by $1.00 per unit, and the profit contribution of tables increases by $2.00 per unit.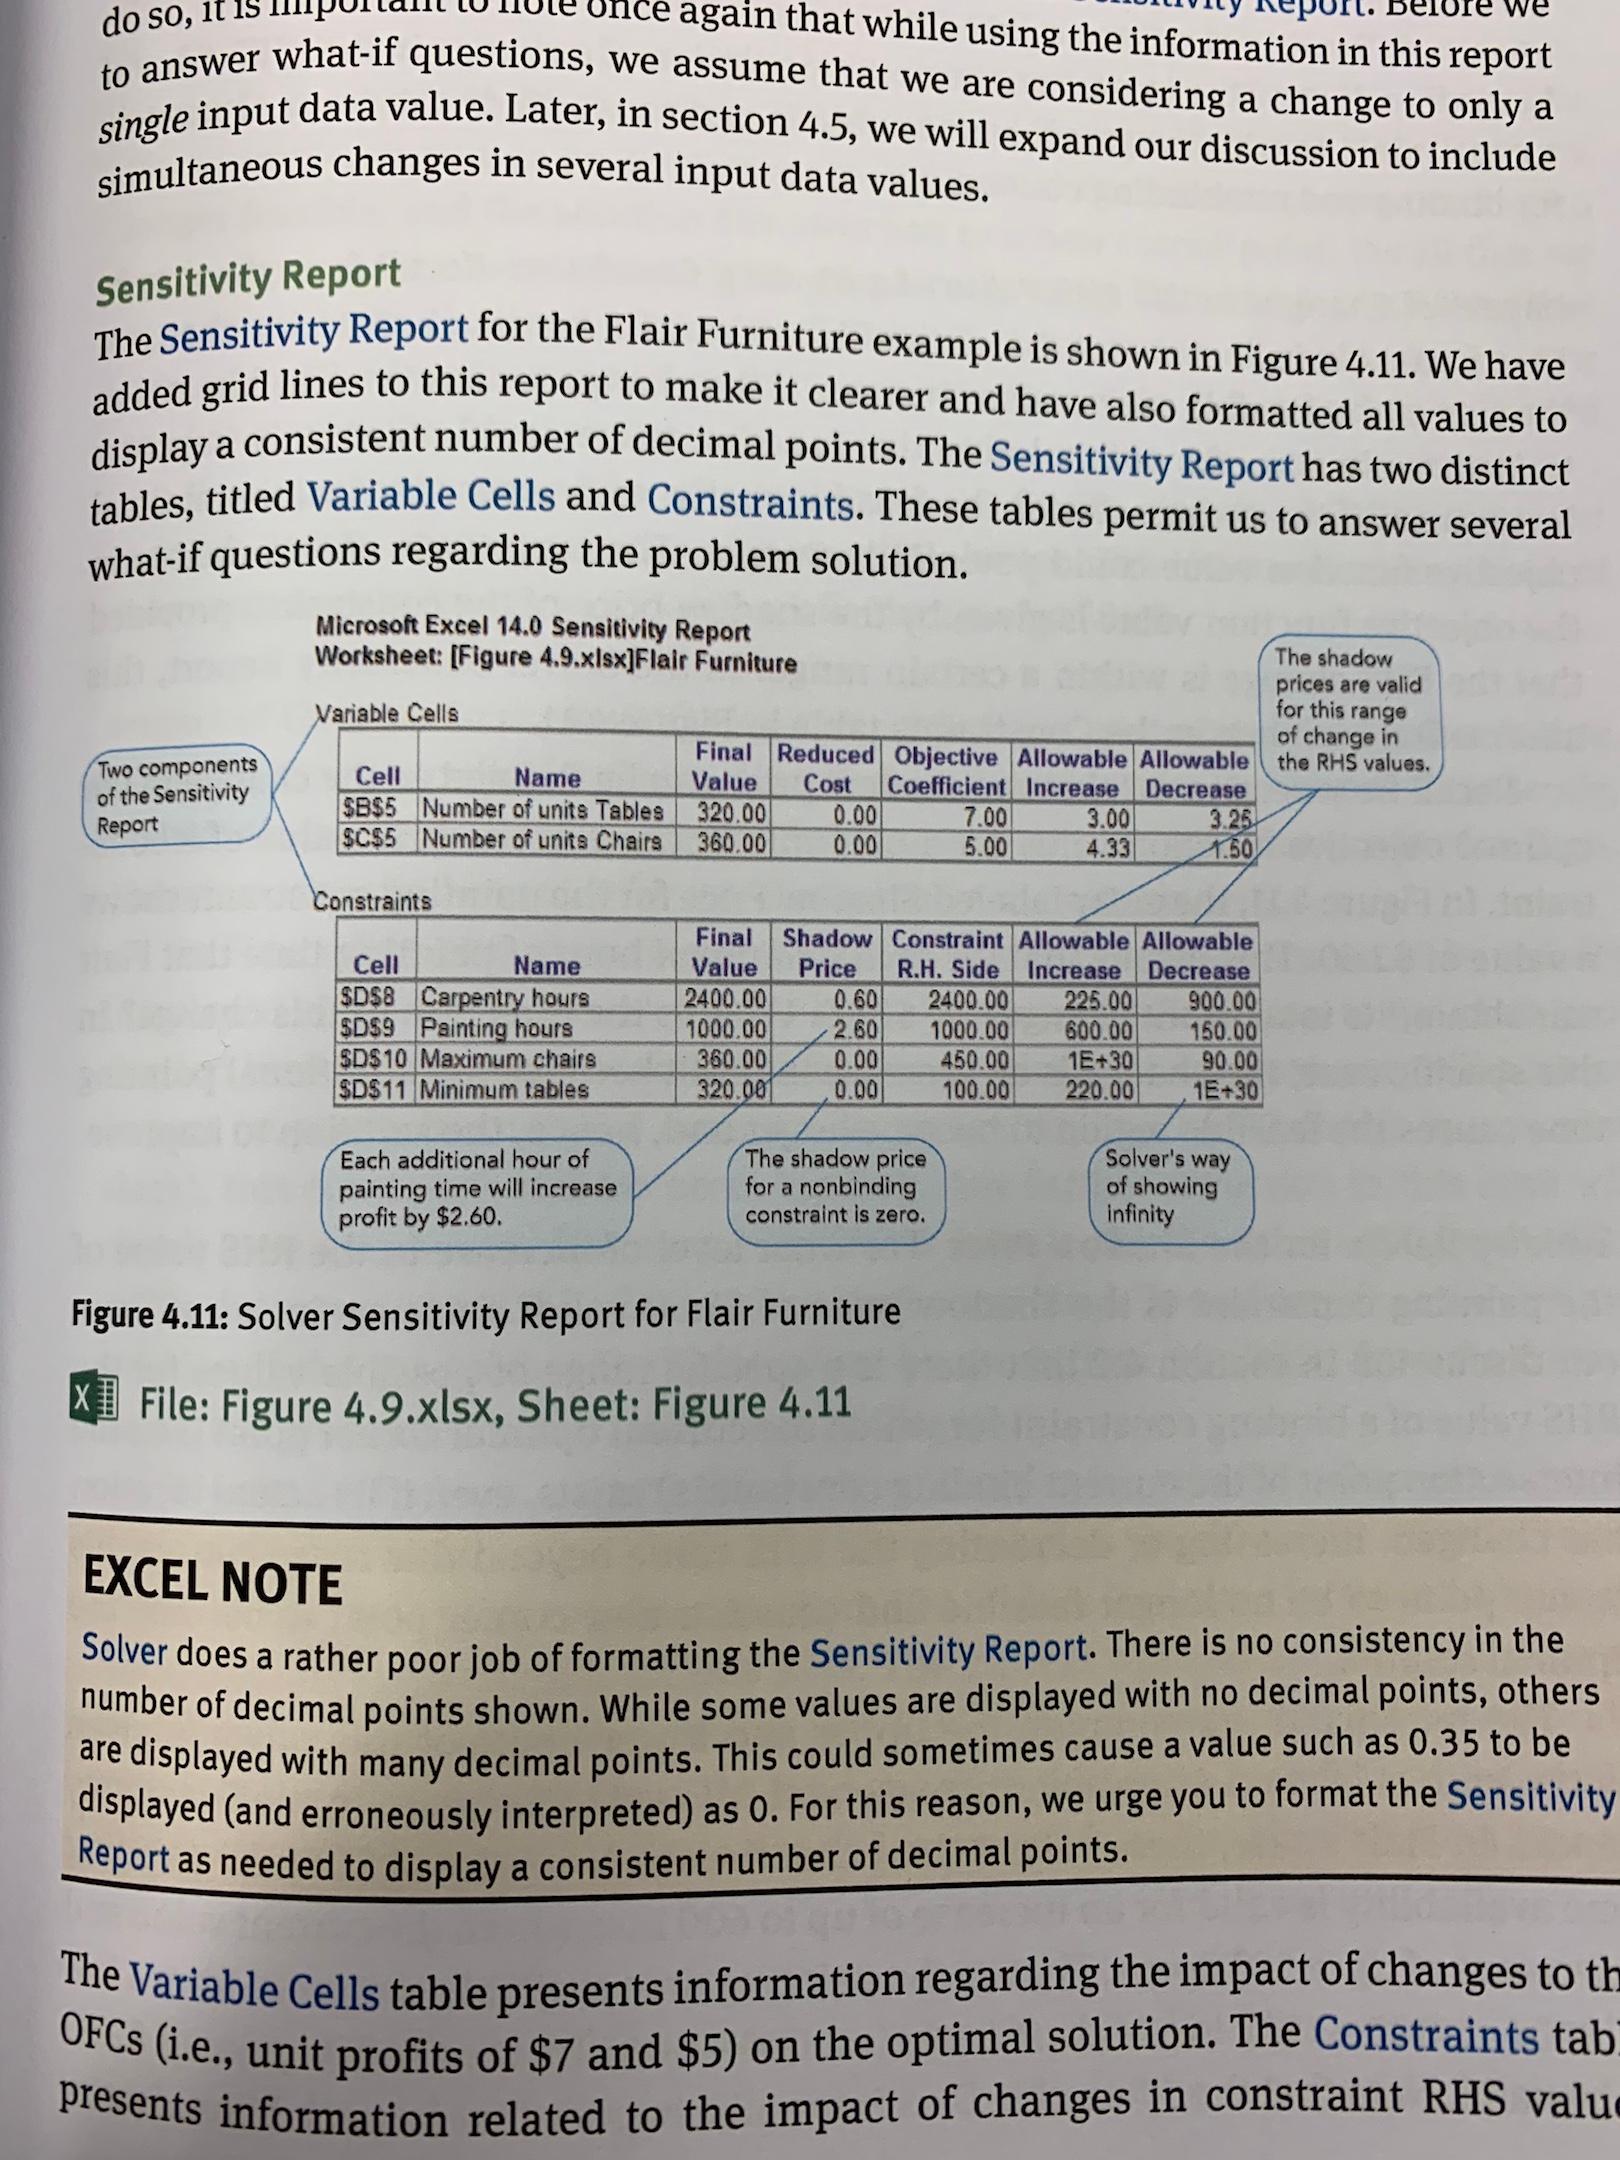
presents information related to the impact of changes in constraint RHS value re we do so, it 15 Sensitivity Report Microsoft Excel 14.0 Sensitivity Report Worksheet: [Figure 4.9.xlsx]Flair Furniture Variable Cells The shadow prices are valid for this range of change in the RHS values. Two components of the Sensitivity Report Cell Name $B$5 Number of units Tables $C$5 Number of units Chairs Final Reduced Objective Allowable Allowable Value Cost Coefficient Increase Decrease 320.00 0.00 7.00 3.00 3.25 360.00 0.00 5.00 4.33 1.50 Constraints single input data value. Later, in section 4.5, we will expand our discussion to include simultaneous changes in several input data values. OFCs (i.e., unit profits of $7 and $5) on the optimal solution. The Constraints tab Once again that while using the information in this report The Sensitivity Report for the Flair Furniture example is shown in Figure 4.11. We have added grid lines to this report to make it clearer and have also formatted all values to display a consistent number of decimal points. The Sensitivity Report has two distinct tables, titled Variable Cells and Constraints. These tables permit us to answer several what-if questions regarding the problem solution. Figure 4.11: Solver Sensitivity Report for Flair Furniture X] File: Figure 4.9.xlsx, Sheet: Figure 4.11 EXCEL NOTE Solver does a rather poor job of formatting the Sensitivity Report. There is no consistency in the number of decimal points shown. While some values are displayed with no decimal points, others are displayed with many decimal points. This could sometimes cause a value such as 0.35 to be displayed (and erroneously interpreted) as 0. For this reason, we urge you to format the Sensitivity Report as needed to display a consistent number of decimal points. The Variable Cells table presents information regarding the impact of changes to th Cell Name SD$& Carpentry hours SDS9 Painting hours $D$10 Maximum chairs SD$11 Minimum tables Final Shadow Constraint Allowable Allowable Value Price R.H. Side Increase Decrease 2400.00 0.60 2400.00 225.00 900.00 1000.00 2.60 1000.00 600.00 150.00 360.00 0.00 450.00 1E+30 90.00 320.001 0.00 100.00 220.00 1E+30 Each additional hour of painting time will increase profit by $2.60. The shadow price for a nonbinding constraint is zero. Solver's way of showing infinity presents information related to the impact of changes in constraint RHS value re we do so, it 15 Sensitivity Report Microsoft Excel 14.0 Sensitivity Report Worksheet: [Figure 4.9.xlsx]Flair Furniture Variable Cells The shadow prices are valid for this range of change in the RHS values. Two components of the Sensitivity Report Cell Name $B$5 Number of units Tables $C$5 Number of units Chairs Final Reduced Objective Allowable Allowable Value Cost Coefficient Increase Decrease 320.00 0.00 7.00 3.00 3.25 360.00 0.00 5.00 4.33 1.50 Constraints single input data value. Later, in section 4.5, we will expand our discussion to include simultaneous changes in several input data values. OFCs (i.e., unit profits of $7 and $5) on the optimal solution. The Constraints tab Once again that while using the information in this report The Sensitivity Report for the Flair Furniture example is shown in Figure 4.11. We have added grid lines to this report to make it clearer and have also formatted all values to display a consistent number of decimal points. The Sensitivity Report has two distinct tables, titled Variable Cells and Constraints. These tables permit us to answer several what-if questions regarding the problem solution. Figure 4.11: Solver Sensitivity Report for Flair Furniture X] File: Figure 4.9.xlsx, Sheet: Figure 4.11 EXCEL NOTE Solver does a rather poor job of formatting the Sensitivity Report. There is no consistency in the number of decimal points shown. While some values are displayed with no decimal points, others are displayed with many decimal points. This could sometimes cause a value such as 0.35 to be displayed (and erroneously interpreted) as 0. For this reason, we urge you to format the Sensitivity Report as needed to display a consistent number of decimal points. The Variable Cells table presents information regarding the impact of changes to th Cell Name SD$& Carpentry hours SDS9 Painting hours $D$10 Maximum chairs SD$11 Minimum tables Final Shadow Constraint Allowable Allowable Value Price R.H. Side Increase Decrease 2400.00 0.60 2400.00 225.00 900.00 1000.00 2.60 1000.00 600.00 150.00 360.00 0.00 450.00 1E+30 90.00 320.001 0.00 100.00 220.00 1E+30 Each additional hour of painting time will increase profit by $2.60. The shadow price for a nonbinding constraint is zero. Solver's way of showing infinity


