

Consider the following two probability distributions for sales: a. Graph the two distributions shown in the table.
Question:
Consider the following two probability distributions for sales: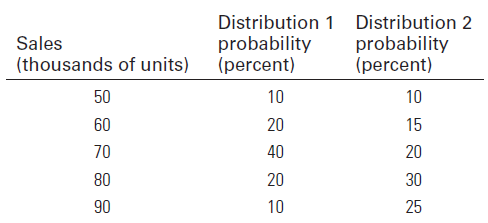 a. Graph the two distributions shown in the table. What are the expected sales for the two probability distributions?b. Calculate the variance and standard deviation for both distributions. Which distribution is more risky?c. Calculate the coefficient of variation for both distributions. Which distribution is more risky relative to its mean?
The word "distribution" has several meanings in the financial world, most of them pertaining to the payment of assets from a fund, account, or individual security to an investor or beneficiary. Retirement account distributions are among the most...
Fantastic news! We've Found the answer you've been seeking!
Step by Step Answer:
Part 1 Graph of Distribution 1 Graph of Distribution 2 Expected Sale ...View the full answer

Answered By
Rajat Seth
I like learning new things and helping people learn new concepts. This is the main reason I'm here.
0 Reviews
10+ Question Solved
Related Book For 

Managerial Economics Foundations of Business Analysis and Strategy
ISBN: 978-0078021909
12th edition
Authors: Christopher Thomas, S. Charles Maurice
Question Posted:
