

The following table gives a football teams season-ticket sales, percentage of games won, and number of active
Question:
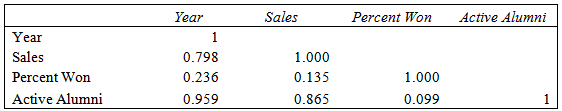
a. Produce a correlation matrix for the variables. Interpret the correlation between each pair of variables. Use some software to help produce the correlation matrix.
b. Estimate a regression model for sales = Percentage of games won. Interpret the results.
c. Estimate a regression model for sales = Number of active alumni. Interpret the results.
d. Conduct a multiple regression to explain ticket sales as a key marketing metric. Interpret the results.
e. Conduct a multiple regression model to predict ticket sales in 2016 presuming that a simple 3-year moving average is used to forecast winning percentage and number of alumni.
Fantastic news! We've Found the answer you've been seeking!
Step by Step Answer:
a Sales and Year have a strong positive correlationBecause Year just indicates timeprogression this ...View the full answer

Answered By
Steve Andrew
My teaching style is an enthusiastic one and fully two-way interaction, I focus mainly on concept building so that even if a student doesn't know the answer he/she can develop the correct approach towards solving the problem in any subject, instead of panicking. My teaching is highly orientated towards creating a smart,critically-thinking human and not just someone who mugs up the whole concepts.
And I truly believe learning is a lifelong process and the learning stops if you think it stops.
0 Reviews
10+ Question Solved
Related Book For 

Exploring Marketing Research
ISBN: 978-1305263529
11th Edition
Authors: Barry J. Babin, William G. Zikmund
Question Posted:
