

Question: Look back at Figure 8 6A. Fig 8-6A (a). Run the percentages vertically and explain what they mean. (b). Express all numbers in the table
Look back at Figure 8 –6A.
Fig 8-6A
 (a). Run the percentages vertically and explain what they mean.
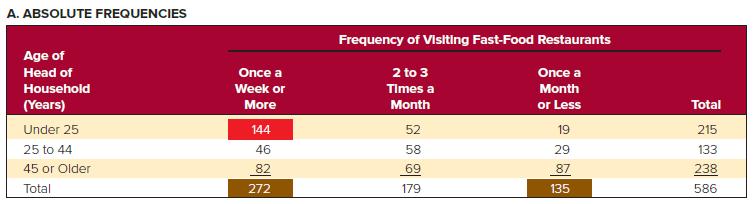
(b). Express all numbers in the table as a percentage of the total number of people sampled (586) and explain what the percentages mean.
A. ABSOLUTE FREQUENCIES Age of Head of Household (Years) Under 25 25 to 44 45 or Older Total Once a Week or More 144 46 82 272 Frequency of Visiting Fast-Food Restaurants 2 to 3 Once a Month Times a Month or Less 52 58 69 179 19 29 87 135 Total 215 133 238 586
Step by Step Solution
3.45 Rating (155 Votes )
There are 3 Steps involved in it
lets calculate the percentages a Running the percentages vertically Age of Head of Household Years ... View full answer

Get step-by-step solutions from verified subject matter experts