

Question: Refer to Data Set 1 Body Data in Appendix B and use the pulse rates of males. a. Find the mean and standard deviation, and
Refer to Data Set 1 “Body Data” in Appendix B and use the pulse rates of males.
a. Find the mean and standard deviation, and verify that the pulse rates have a distribution that is roughly normal.
b. Treating the unrounded values of the mean and standard deviation as parameters, and assuming that male pulse rates are normally distributed, find the pulse rate separating the lowest 2.5% and the pulse rate separating the highest 2.5%. These values could be helpful when physicians try to determine whether pulse rates are significantly low or significantly high.
Refer to the data sets in Appendix B and use software or a calculator.
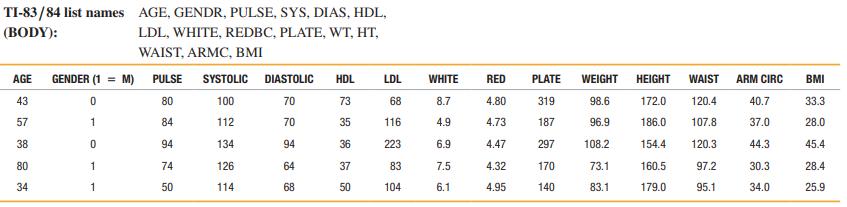
Data Set 1: Body Data
Body and exam measurements are from 300 subjects (first five rows shown here). AGE is in years, for GENDER 1 = male and 0 = female, PULSE is pulse rate (beats per minute), SYSTOLIC is systolic blood pressure (mm Hg), DIASTOLIC is diastolic blood pressure (mm Hg), HDL is HDL cholesterol (mg/dL), LDL is LDL cholesterol (mg/dL), WHITE is white blood cell count (1000 cells/mL), RED is red blood cell count (million cells/mL), PLATE is platelet count (1000 cells/mL), WEIGHT is weight (kg), HEIGHT is height (cm), WAIST is waist circumference (cm), ARM CIRC is arm circumference (cm), and BMI is body mass index (kg/m2). Data are from the National Center for Health Statistics.
Step by Step Solution
3.45 Rating (164 Votes )
There are 3 Steps involved in it

Get step-by-step solutions from verified subject matter experts