

In Problem use Appendix C to find the area under the standard normal curve and above the
Question:
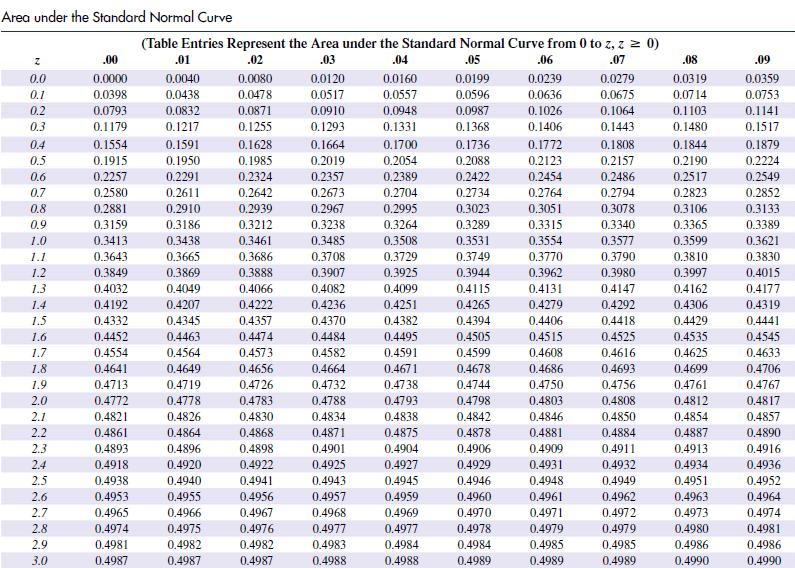
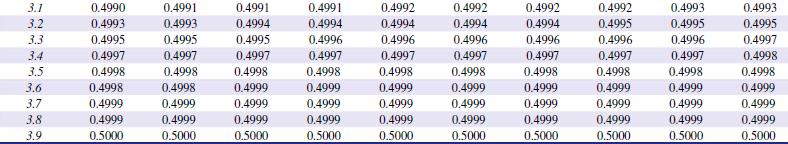
In Problem use Appendix C to find the area under the standard normal curve and above the given interval on the horizontal axis.
[–0.5, 0.3]
Data from Appendix C
Fantastic news! We've Found the answer you've been seeking!
Step by Step Answer:
To find the area under the standard normal curve and above the interval 05 03 we need to calculate t...View the full answer

Answered By
Branice Buyengo Ajevi
I have been teaching for the last 5 years which has strengthened my interaction with students of different level.
1+ Reviews
10+ Question Solved
Related Book For 

Finite Mathematics For Business Economics Life Sciences And Social Sciences
ISBN: 9780134862620
14th Edition
Authors: Raymond Barnett, Michael Ziegler, Karl Byleen, Christopher Stocker
Question Posted:
