

In Problem use Appendix C to find the area under the standard normal curve and above the
Question:
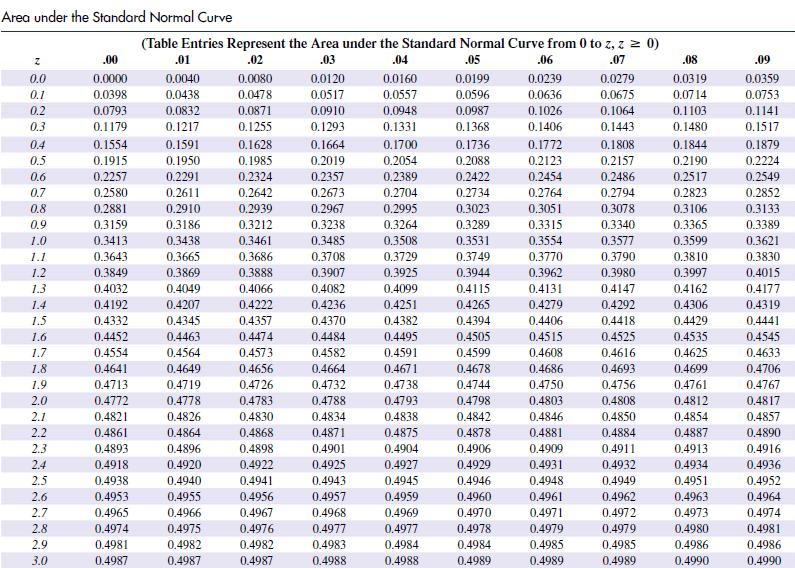
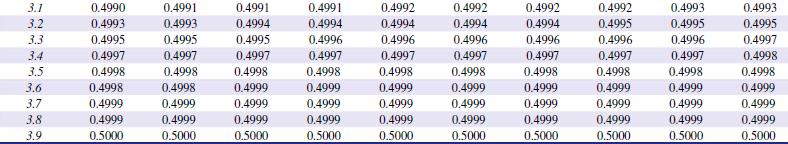
In Problem use Appendix C to find the area under the standard normal curve and above the given interval on the horizontal axis.
[–1, 1]
Data from Appendix C
Fantastic news! We've Found the answer you've been seeking!
Step by Step Answer:
To find the area under the standard normal curve and above the interval 1 1 we need to calculate the ...View the full answer

Answered By
Qurat Ul Ain
Successful writing is about matching great style with top content. As an experienced freelance writer specialising in article writing and ghostwriting, I can provide you with that perfect combination, adapted to suit your needs.
I have written articles on subjects including history, management, and finance. Much of my work is ghost-writing, so I am used to adapting to someone else's preferred style and tone. I have post-graduate qualifications in history, teaching, and social science, as well as a management diploma, and so am well equipped to research and write in these areas.
265+ Reviews
421+ Question Solved
Related Book For 

Finite Mathematics For Business Economics Life Sciences And Social Sciences
ISBN: 9780134862620
14th Edition
Authors: Raymond Barnett, Michael Ziegler, Karl Byleen, Christopher Stocker
Question Posted:
