

Refer to Matched Problem 1 in Section 9.1, where we found the following transition matrix for an
Question:
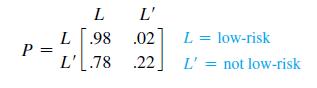
Refer to Matched Problem 1 in Section 9.1, where we found the following transition matrix for an insurance company:
If these probabilities remain valid for a long period of time, what percentage of drivers are expected to be in the low-risk category during any given year?
Data from Matched Problem 1 in Section 9.1
An insurance company classifies drivers as low-risk if they are accident-free for one year. Past records indicate that 98% of the drivers in the low-risk category (L) one year will remain in that category the next year, and 78% of the drivers who are not in the low-risk category (L′) one year will be in the low-risk category the next year.
Draw a transition diagram.
Find the transition matrix P.
If 90% of the drivers in the community are in the low-risk category this year, what is the probability that a driver chosen at random from the community will be in the low-risk category next year? Year after next?
Step by Step Answer:


Finite Mathematics For Business Economics Life Sciences And Social Sciences
ISBN: 9780134862620
14th Edition
Authors: Raymond Barnett, Michael Ziegler, Karl Byleen, Christopher Stocker
