

Refer to Problem 43. After making a series of adjustments for things like taxes, fringe benefits, and
Question:
Refer to Problem 43. After making a series of adjustments for things like taxes, fringe benefits, and returns on home equity, the income distribution for the United States in 1999 is represented by the Lorenz curve y = g(x), where g(x) is given in the table.
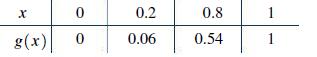
(A) Find the interpolating polynomial for this table.
(B) Use the interpolating polynomial to approximate (to four decimal places) the index of income concentration.
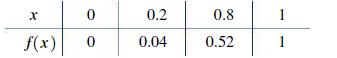
Data from Problem 43
The income distribution for the United States in 1999 is represented by the Lorenz curve y = f(x), where f(x) is given in the table.
Fantastic news! We've Found the answer you've been seeking!
Step by Step Answer:
A Use the Lagranges Interpolation formula as follows px xxxx2xx3 x x x ...View the full answer

Answered By
Leah Muchiri
I am graduate in Bachelor of Actuarial Science and a certified accountant. I am also a prolific writer with six years experience in academic writing. My working principle are being timely and delivering 100% plagiarized free work. I usually present a precised solution to every work am assigned to do. Most of my student earn A++ GRADE using my precised and correct solutions.
52+ Reviews
125+ Question Solved
Related Book For 

Finite Mathematics For Business Economics Life Sciences And Social Sciences
ISBN: 9780134862620
14th Edition
Authors: Raymond Barnett, Michael Ziegler, Karl Byleen, Christopher Stocker
Question Posted:
