

Table 3.16 shows the prices of a good for each year between Year 1 and Year 6.
Question:
Table 3.16 shows the prices of a good for each year between Year 1 and Year 6.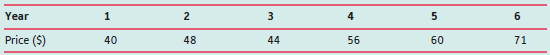 (a) Work out the index numbers, correct to one decimal place, taking Year 2 as the base year.
(b) If the index number for Year 7 is 135, calculate the corresponding price. You may assume that the base year is still Year 2.
(c) If the index number in Year 3 is approximately 73, find the year that is used as the base year.
Fantastic news! We've Found the answer you've been seeking!
Step by Step Answer:
40 48 60 a x100833 100 x1...View the full answer

Answered By
Muhammad Umair
I have done job as Embedded System Engineer for just four months but after it i have decided to open my own lab and to work on projects that i can launch my own product in market. I work on different softwares like Proteus, Mikroc to program Embedded Systems. My basic work is on Embedded Systems. I have skills in Autocad, Proteus, C++, C programming and i love to share these skills to other to enhance my knowledge too.
1+ Reviews
10+ Question Solved
Related Book For 

Question Posted:
