

The following table shows priceearnings ratios of 100 common stocks chosen at random from the New York
Question:
The following table shows price–earnings ratios of 100 common stocks chosen at random from the New York Stock Exchange.
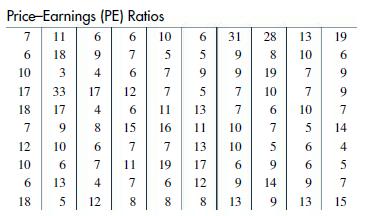
(A) Construct a frequency and relative frequency table using a class interval of 5, starting at -0.5.
(B) Construct a histogram.
(C) Construct a frequency polygon.
(D) Construct a cumulative frequency and relative cumulative frequency table. What is the probability that a price– earnings ratio drawn at random from the sample will fall between 4.5 and 14.5?
(E) Construct a cumulative frequency polygon.
Fantastic news! We've Found the answer you've been seeking!
Step by Step Answer:

Answered By
Joseph Mwaura
I have been teaching college students in various subjects for 9 years now. Besides, I have been tutoring online with several tutoring companies from 2010 to date. The 9 years of experience as a tutor has enabled me to develop multiple tutoring skills and see thousands of students excel in their education and in life after school which gives me much pleasure. I have assisted students in essay writing and in doing academic research and this has helped me be well versed with the various writing styles such as APA, MLA, Chicago/ Turabian, Harvard. I am always ready to handle work at any hour and in any way as students specify. In my tutoring journey, excellence has always been my guiding standard.
1+ Reviews
10+ Question Solved
Related Book For 

Finite Mathematics For Business Economics Life Sciences And Social Sciences
ISBN: 9780134862620
14th Edition
Authors: Raymond Barnett, Michael Ziegler, Karl Byleen, Christopher Stocker
Question Posted:
